Over the last few months, I’ve been working with a brilliant travel behavior analyst, Nancy McGuckin, to interpret the travel to school data in the California National Household Travel Survey. Nancy’s analysis has revealed that many more Californians walk than travelers nationwide, which includes both walking adults as well as kids traveling to school. Our report is nearly complete and should be out in the next month (stay tuned!) but I’d like to share a few highlights of our findings to whet your appetite for all the great analysis in the report.
- 26-31 percent of children in California walk and bicycle to and from school, more than twice the national average of 12-15 percent
- Children aged 5-15 that walk to school make more walking trips overall, which anchors walking as an important mode of transportation for the rest of their lives
- Almost two-thirds of children in California live within walking or bicycling distance from school (within two miles), and over half of those children are driven to school, indicating a high potential to get more kids walking and bicycling to school with more Safe Routes to School initiatives
In the last week, I had reason to dig into some of the safety data for California for a report on how Safe Routes to School has benefitted safety for children in the state. I reviewed the last decade of serious injuries and fatalities to pedestrians and bicyclists aged 5-15 resulting from auto-related collisions in the California Highway Patrol’s crash records database. I discovered both interesting and alarming trends.
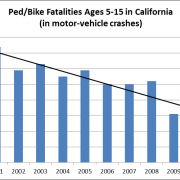
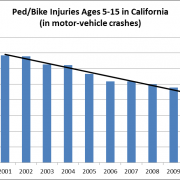
- Serious injuries and fatalities inflicted on children walking and bicycling by auto collisions have declined steadily since 2001, when Safe Routes to School projects began to be completed in California (see graphs below)
- Yet, 40 percent of children killed and 27 percent of children seriously injured in auto collisions in 2010 were walking or bicycling, so the relative safety risk to children walking and bicycling is still unreasonably high


Statewide Integrated Traffic Records System (SWITRS) http://www.chp.ca.gov/switrs/
What all this data analysis tells me is that our network’s advocacy effort for Safe Routes to School in California is critically important, and we need to take advantage of the story this data can tell when making our case. Safe Routes to School has already done a lot to improve safety and get kids walking and bicycling, but both the safety risk and the potential for changing more travel habits are high! My resolution for 2013 is to ensure these data keep trending in the right direction.

