We’ve developed state report cards which provide a snapshot of how supportive each state is of walking, bicycling, and physical activity for children and adults as of 2024.
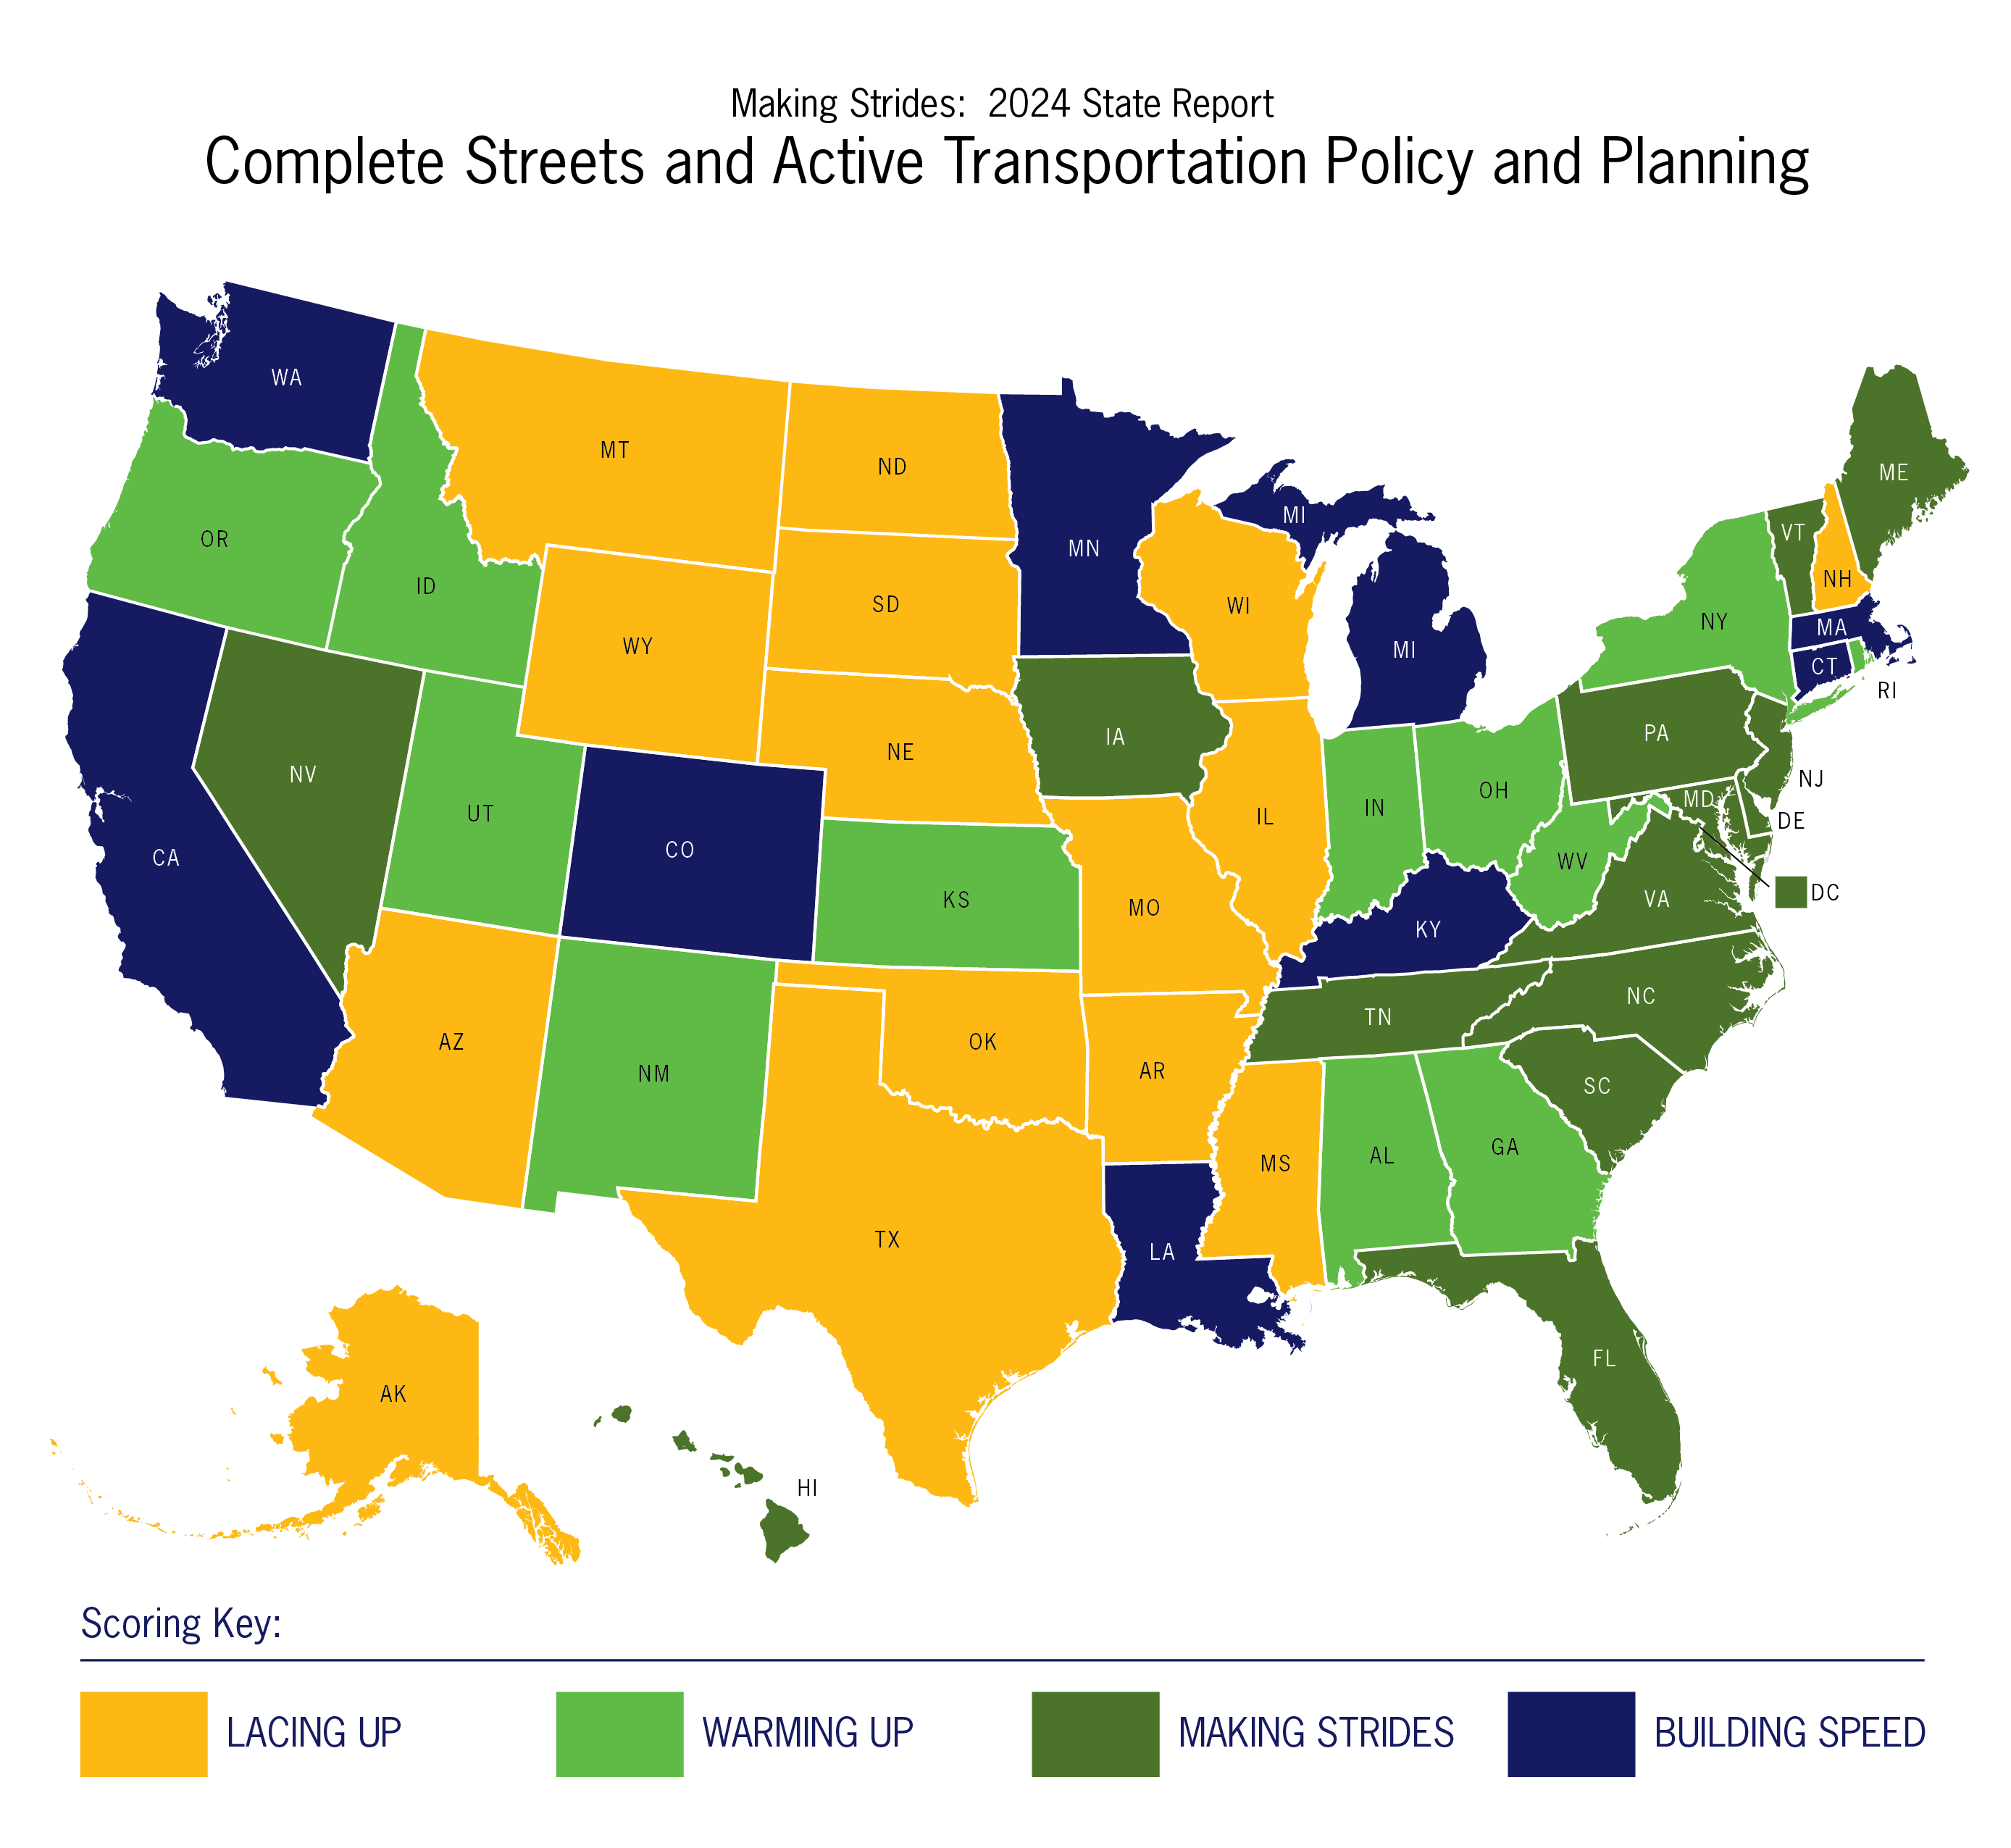
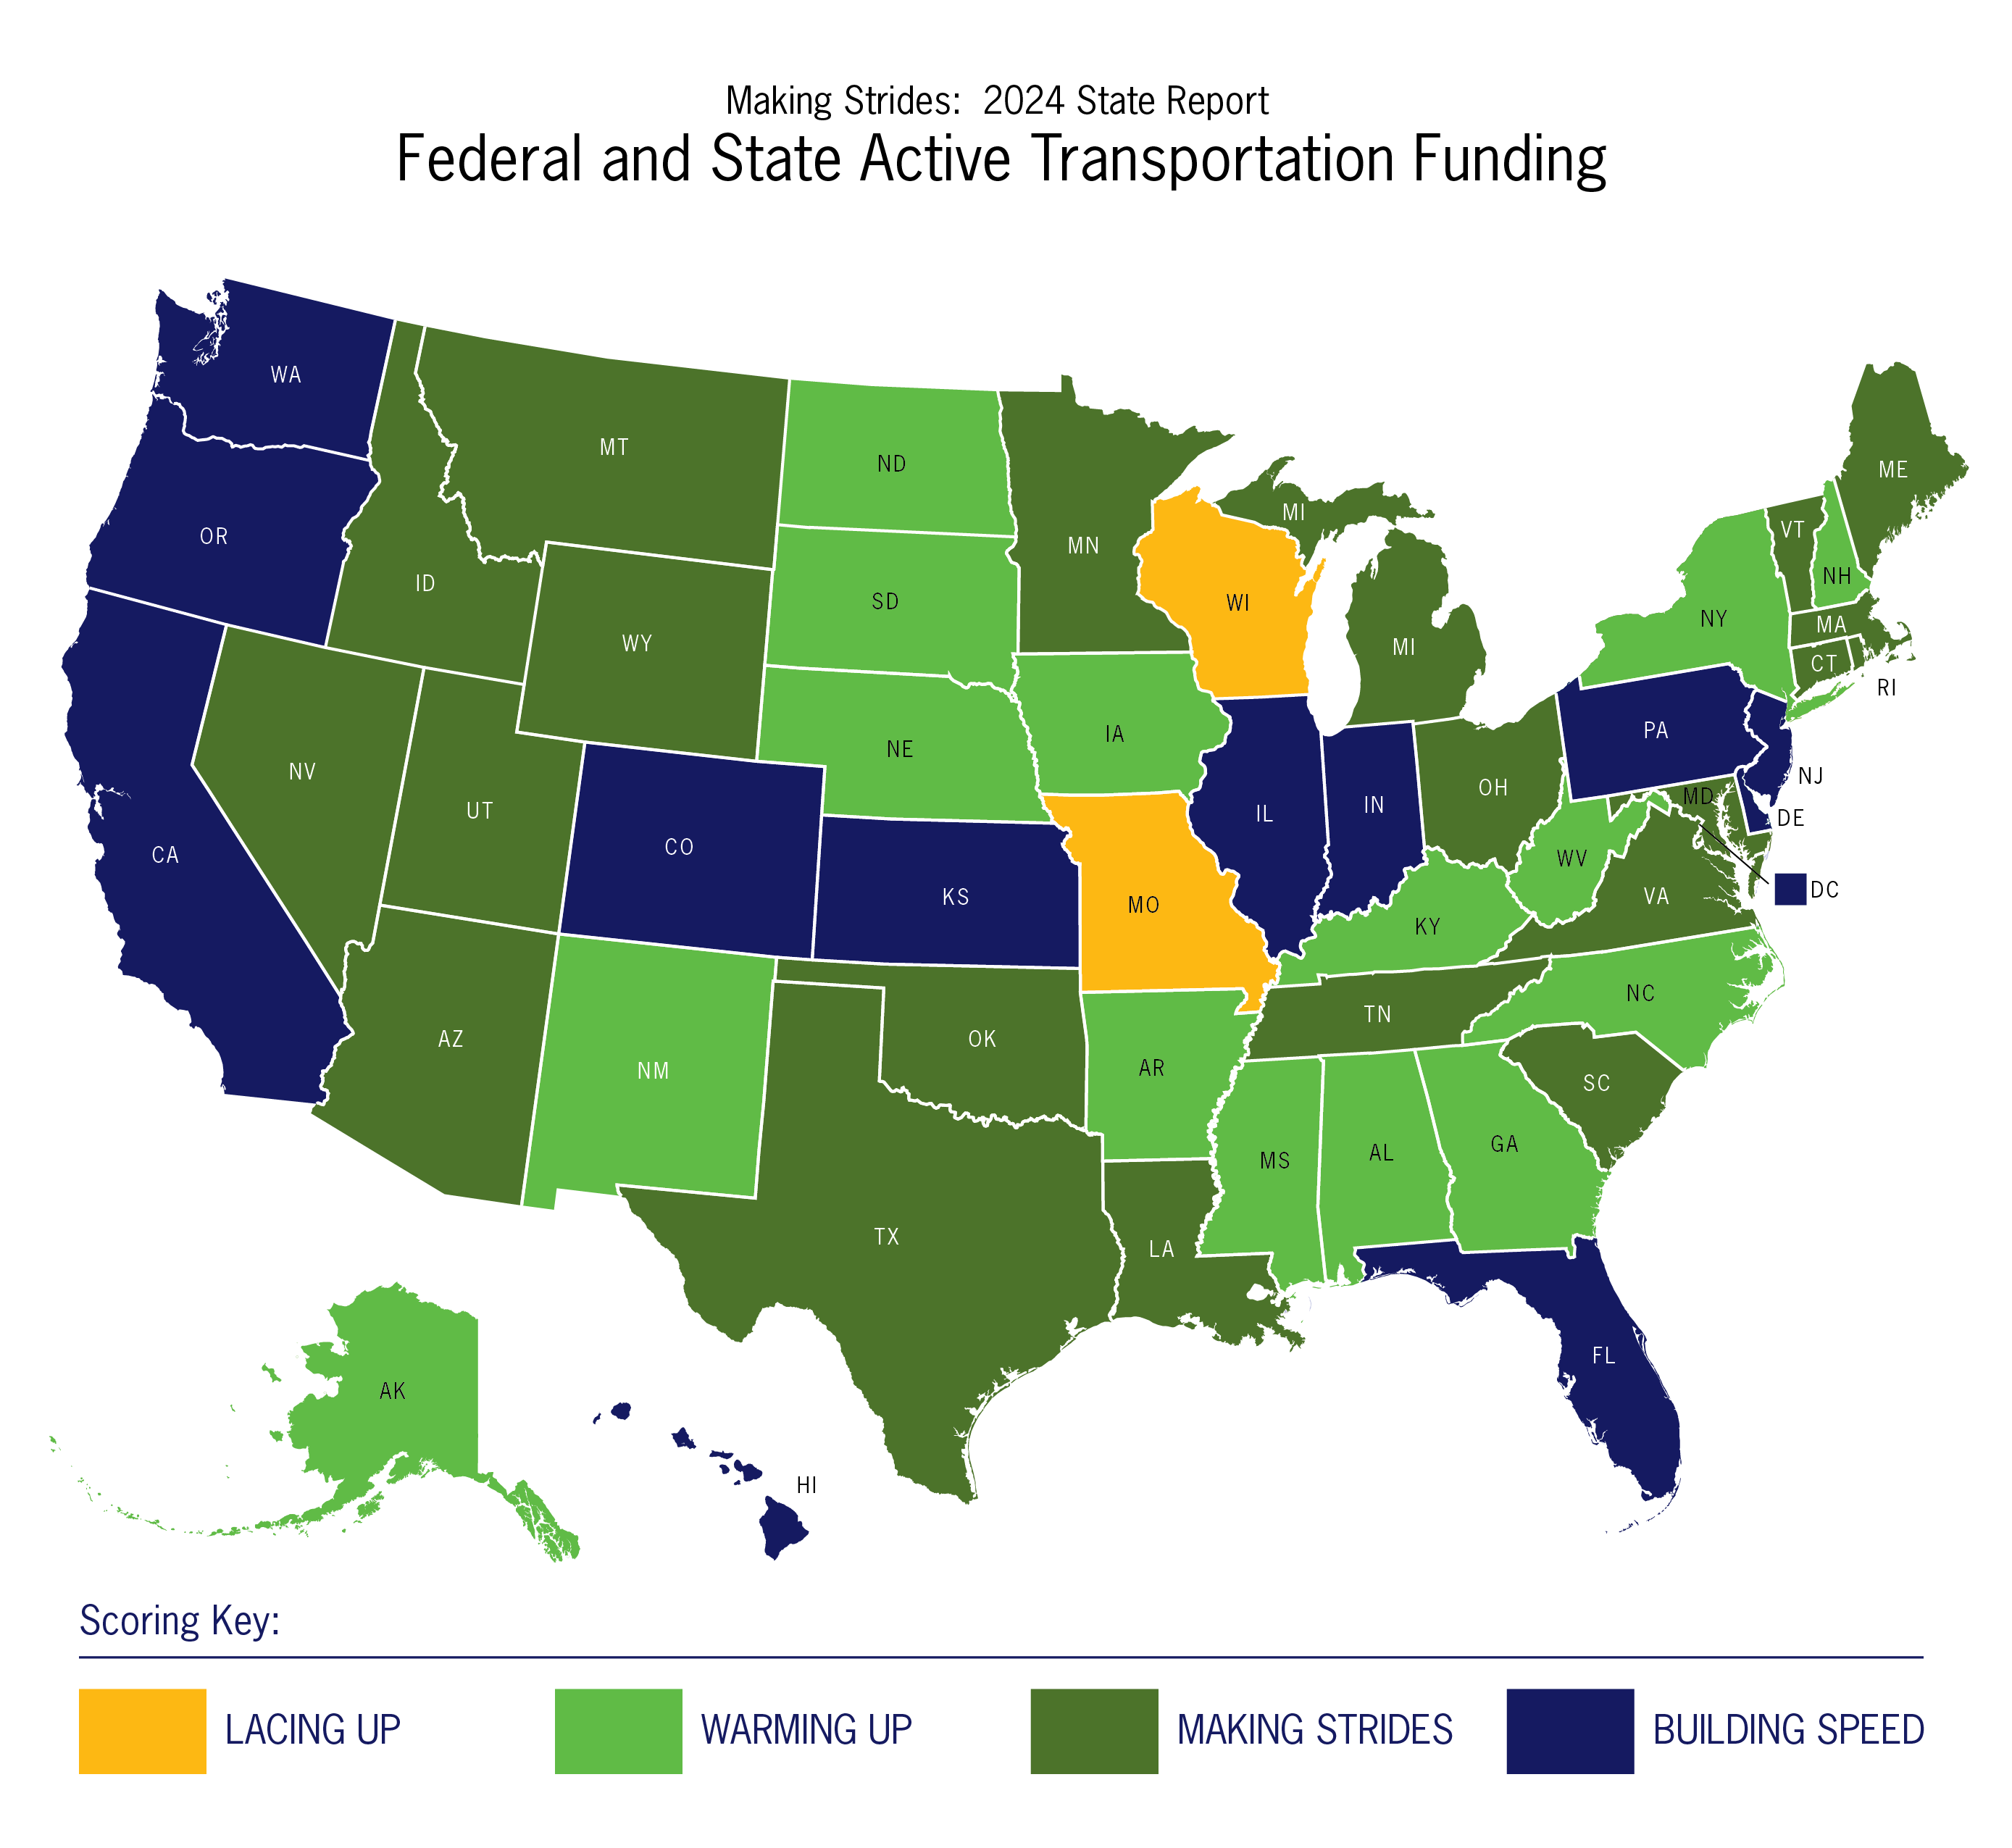
The report cards primarily look at state policy, focusing on four key areas: Complete Streets and Active Transportation Policy and Planning, Federal and State Active Transportation Funding, Safe Routes to School Funding and Supportive Practices, and Active Neighborhoods and Schools. Click on the map to view each state’s report card.
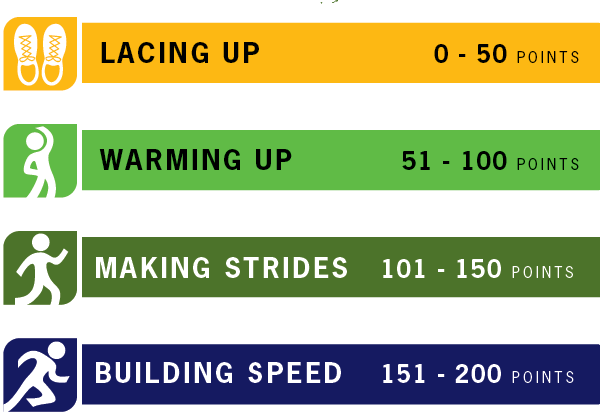
The full report includes a detailed explanation of how the states were graded. Download a quick guide to understanding the report card scores and grading and a fact sheet on how to use your state report card.
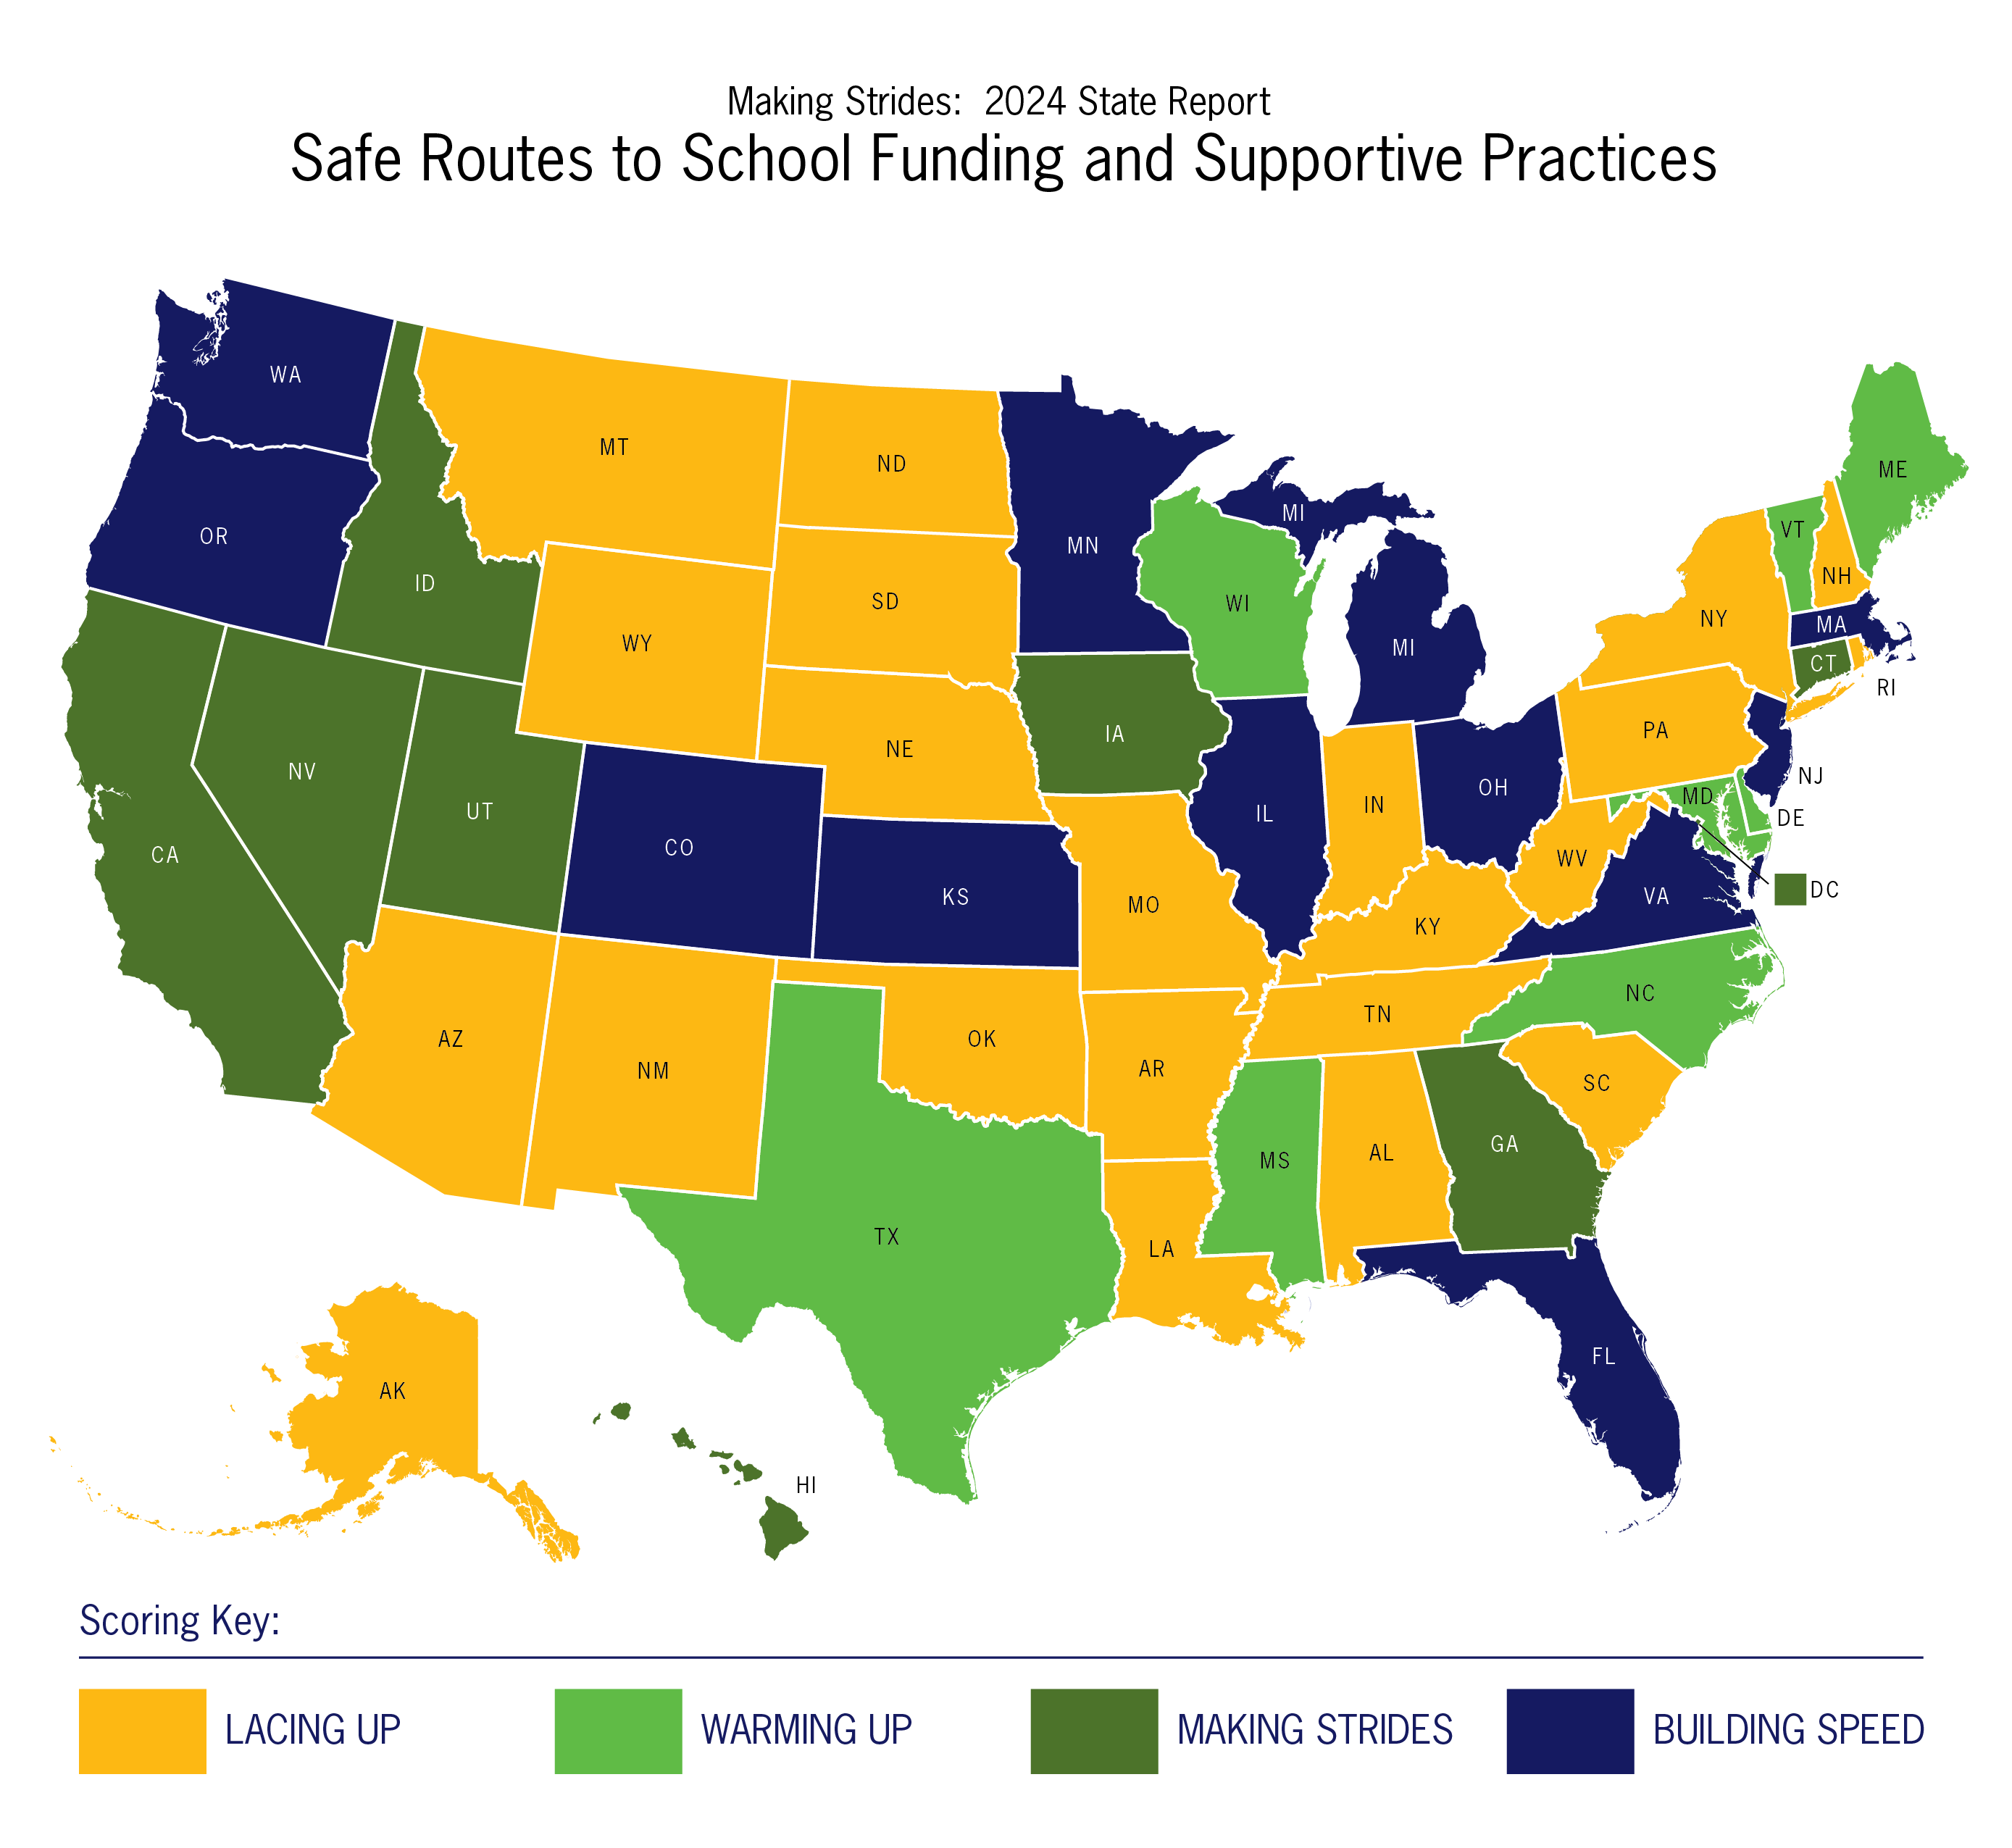
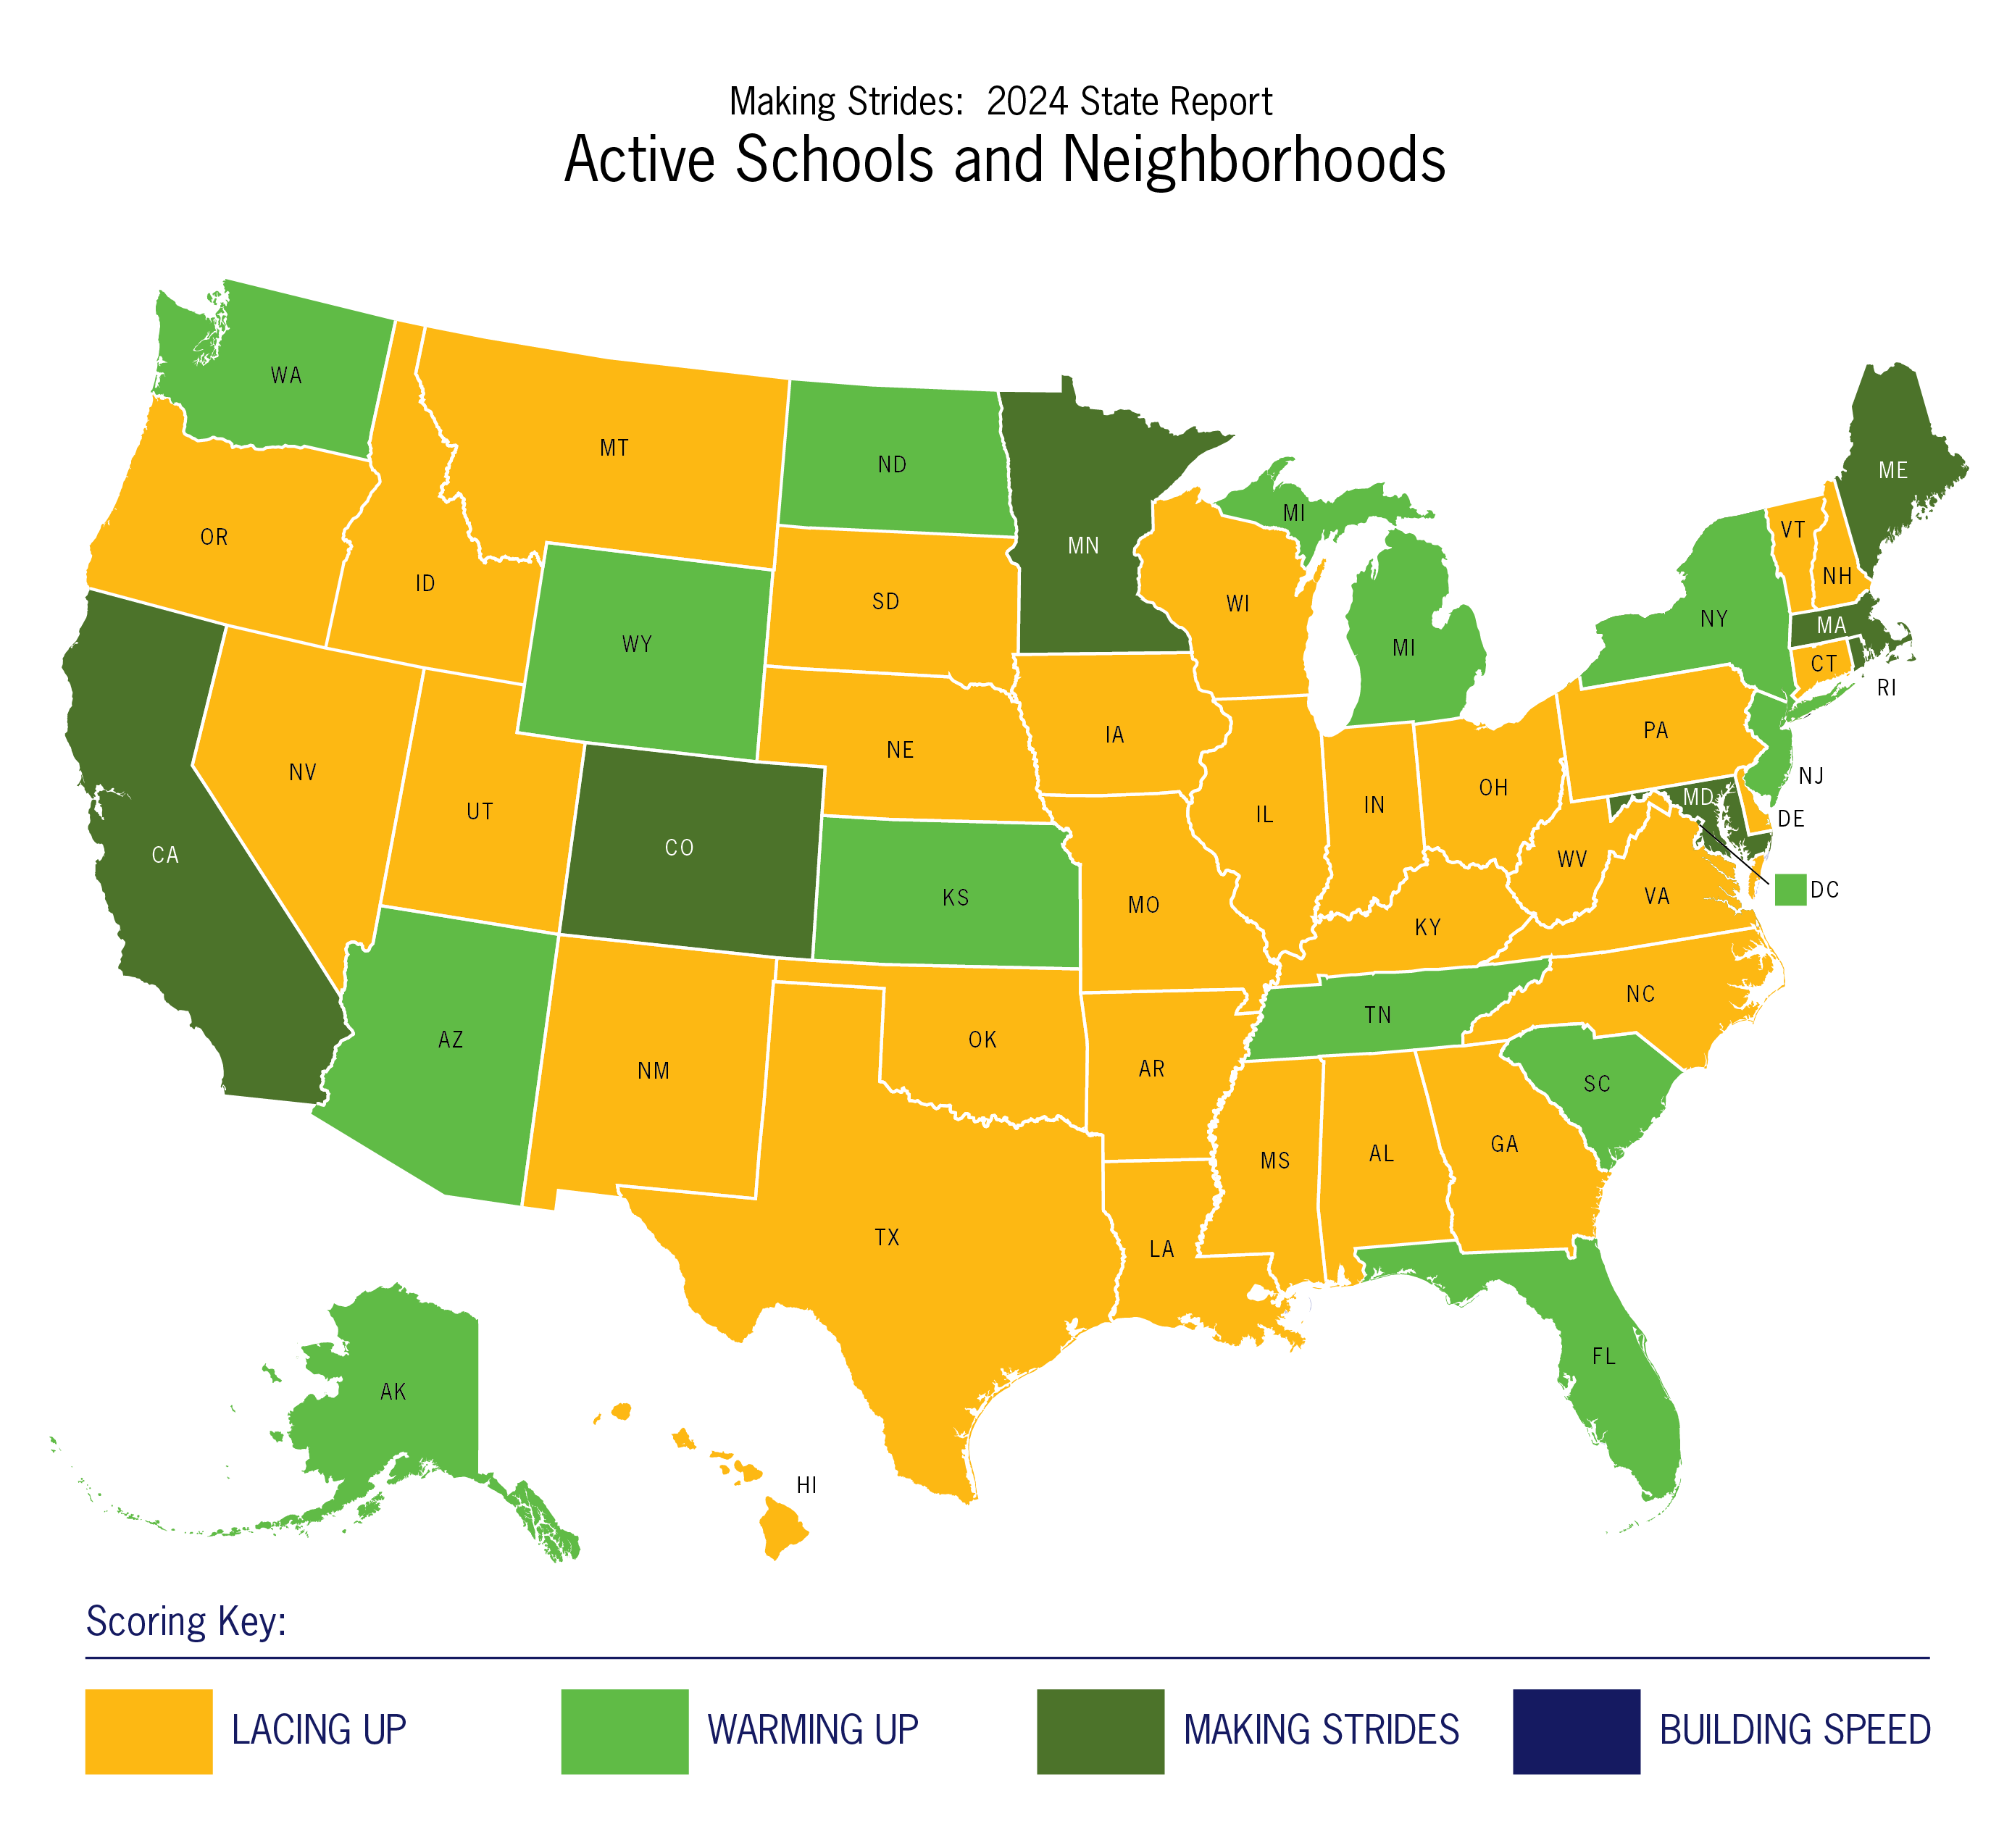
Overall scores for core topic areas:
Complete Streets and Active Transportation Policy and Planning | Federal and State Active Transportation Funding | Safe Routes to School Funding and Supportive Practices | Active Schools and Neighborhoods
The maps below show grades and information about key indicators for each state:
Complete Streets: Policy Type and Strength | Special Consideration for High Need Communities within Transportation Alternatives Program | Matching Funds for Transportation Alternatives Program | State Funding for Active Transportation | Safe Routes to School Staffing | SRTS and Non-Infrastructure Funding | School Siting | Appendices



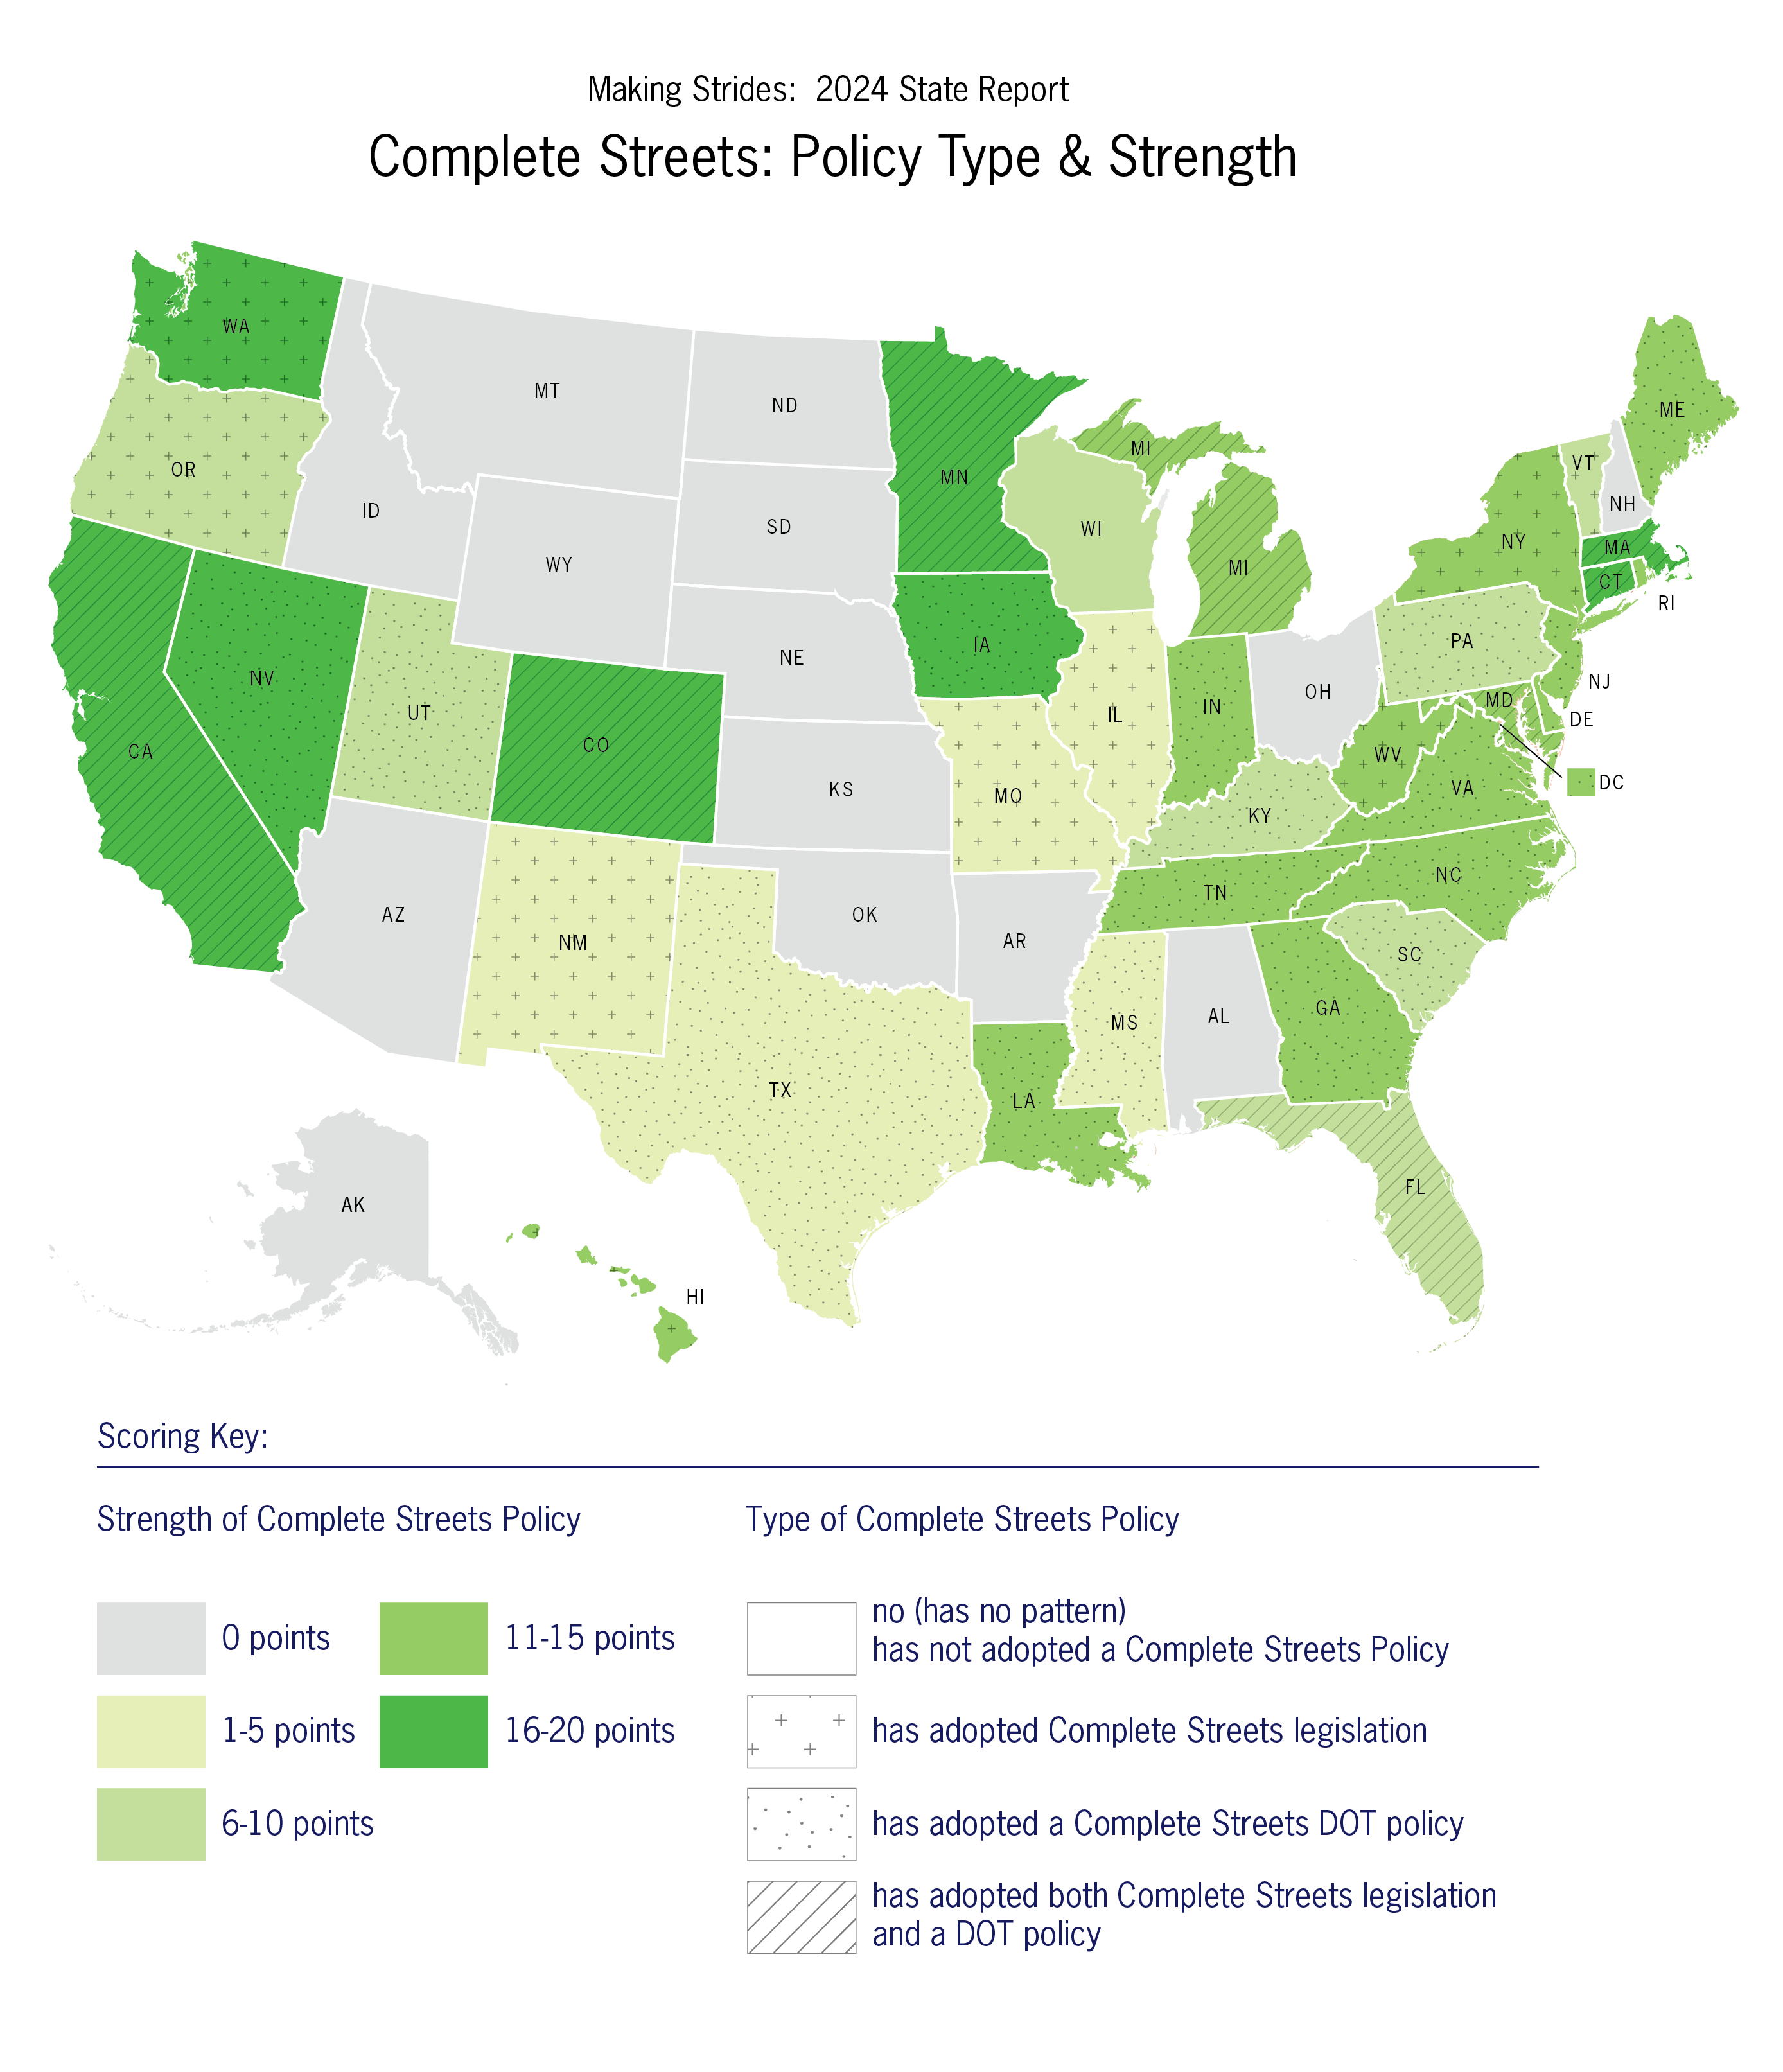
This map (Figure 1 in the report) indicates what type of Complete Streets policy a state has adopted, if any, and how strong the state’s Complete Streets policy is according to the National Complete Streets Coalition’s analysis. Overall, 37 states have some form of Complete Streets policy in place, with DOT policies being the primary tool that states rely on to put in place Complete Streets at the state level.

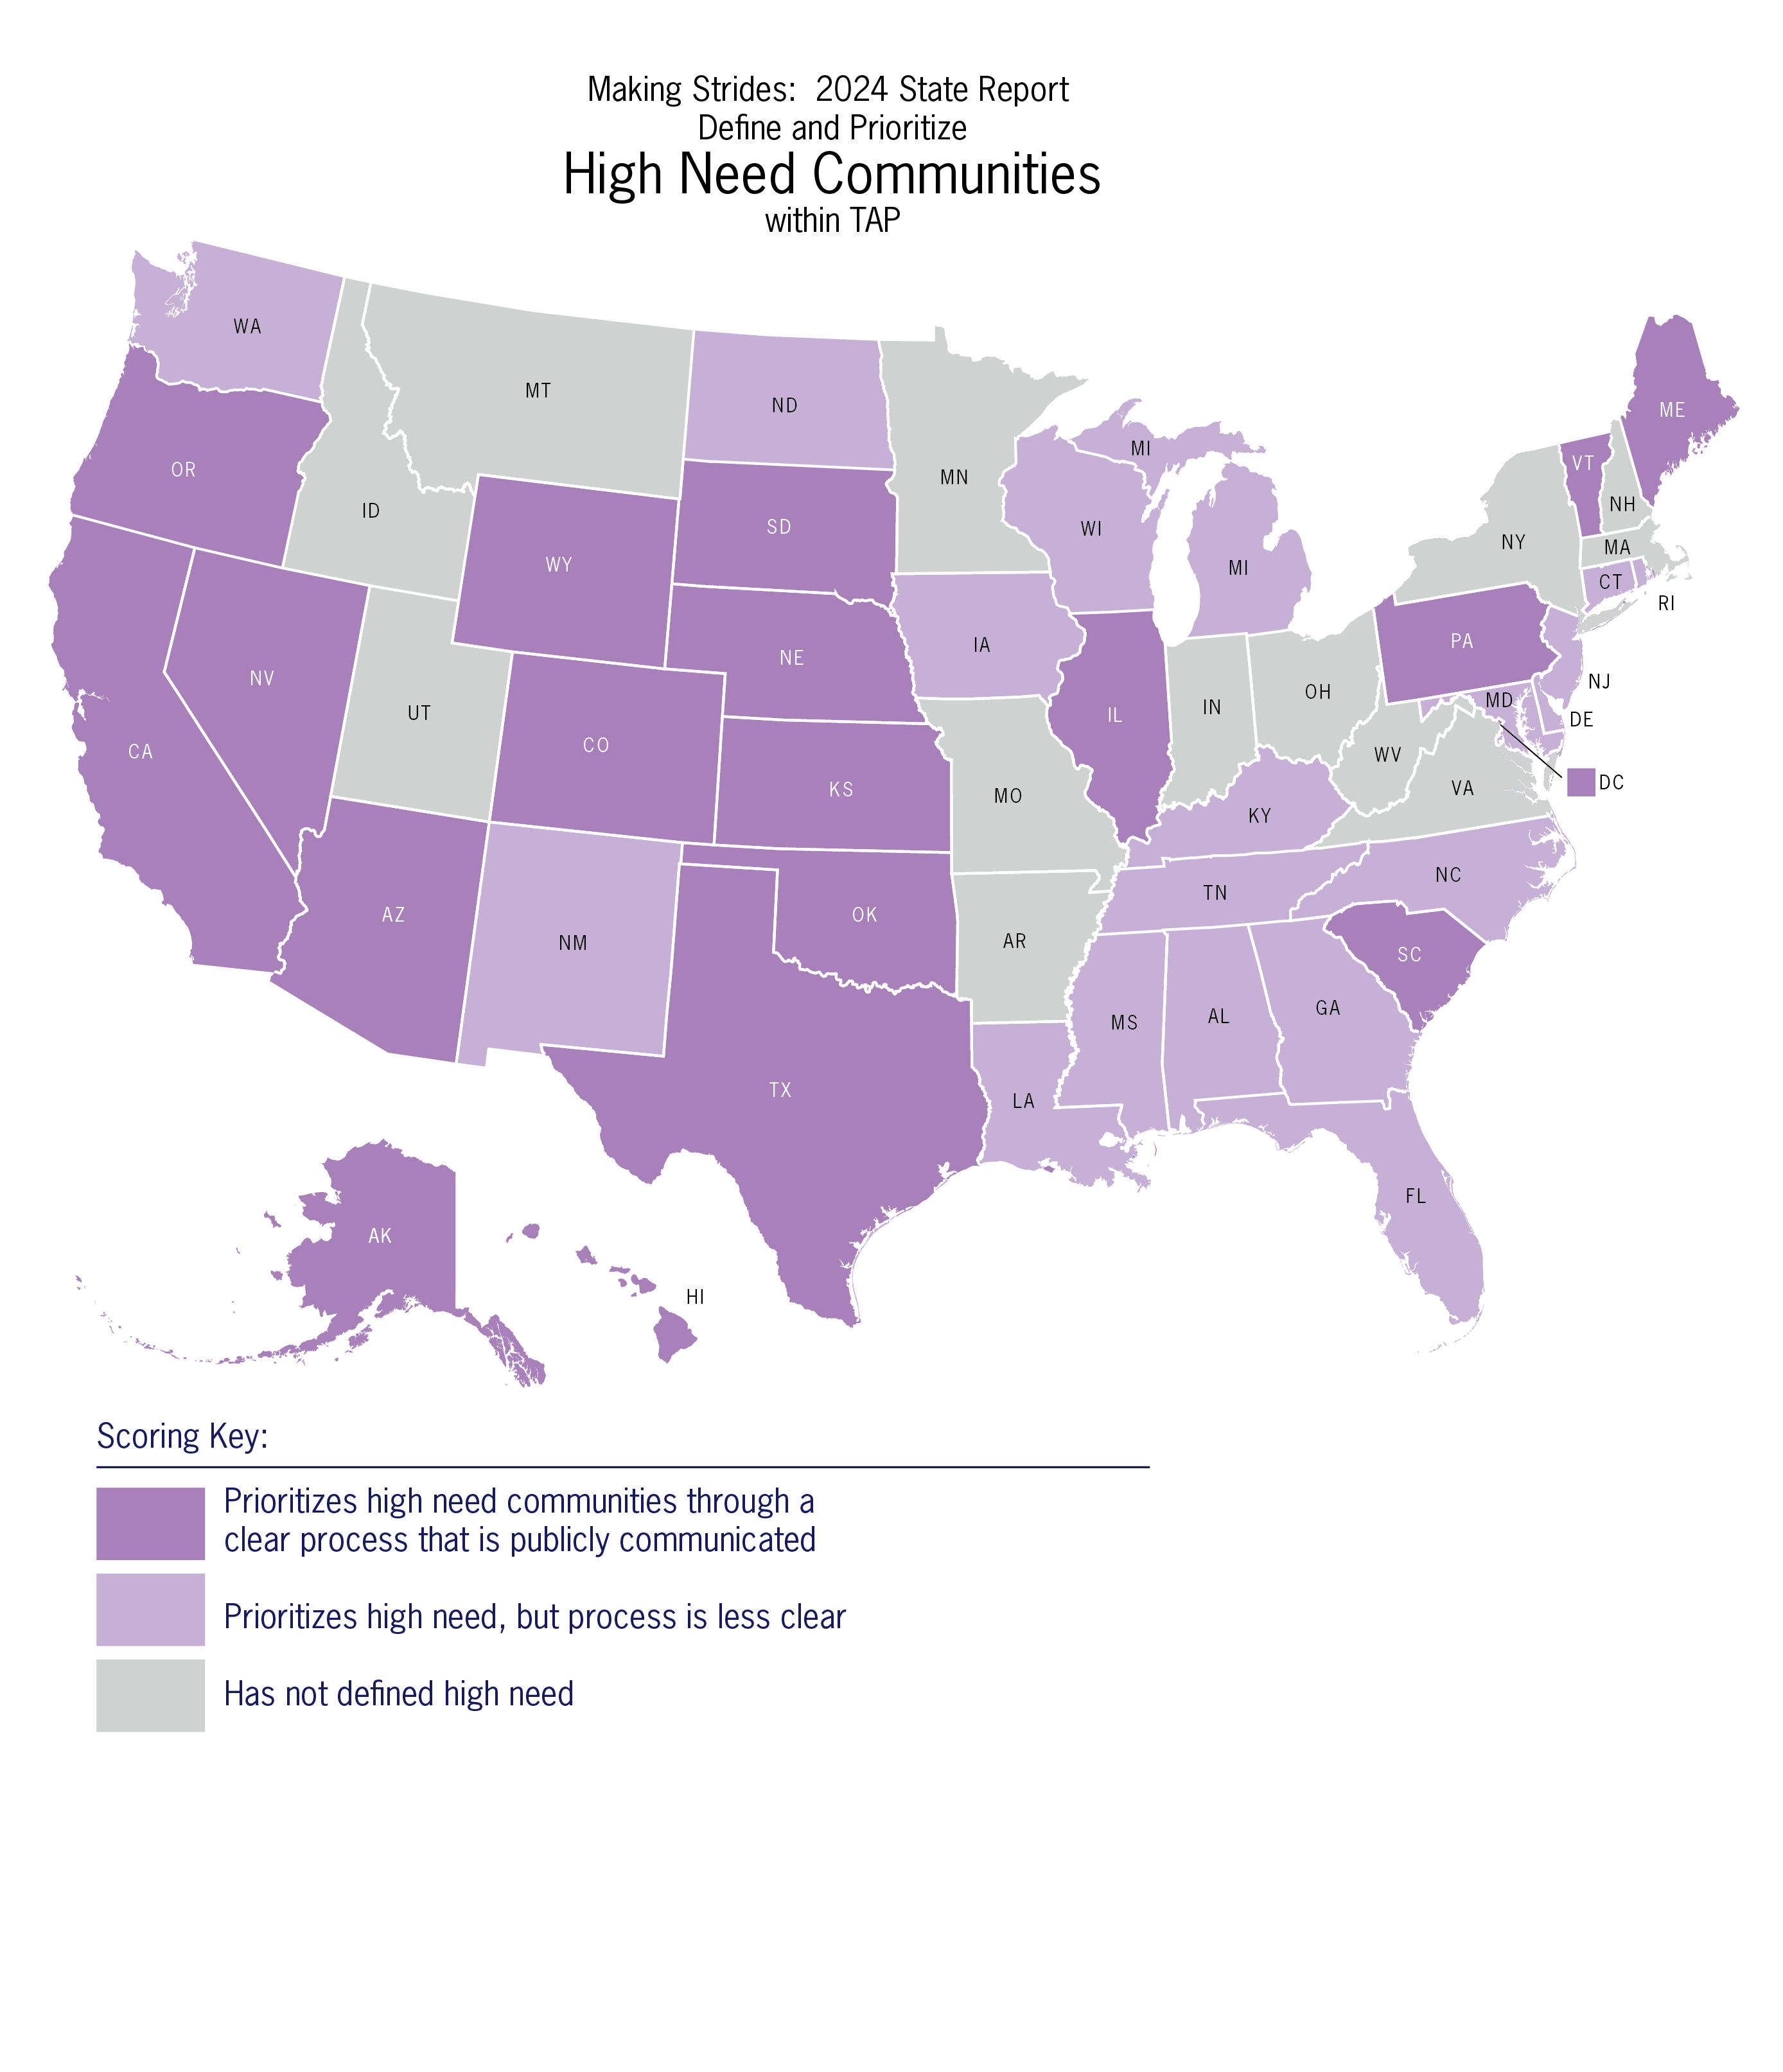
This map (Figure 2 in the report) indicates whether states provide either special consideration and/or matching funds for high need communities in allocating TAP funding. The number of states who utilize an equity consideration when awarding TAP projects has been growing steadily since we started tracking this in 2018. Most recently, in 2022 24 states prioritized high need communities in TAP scoring. In 2024, 38 states defined and prioritized high-need communities within TAP suggesting many states recognize the barriers many communities face accessing these funds and are trying to reduce these barriers.

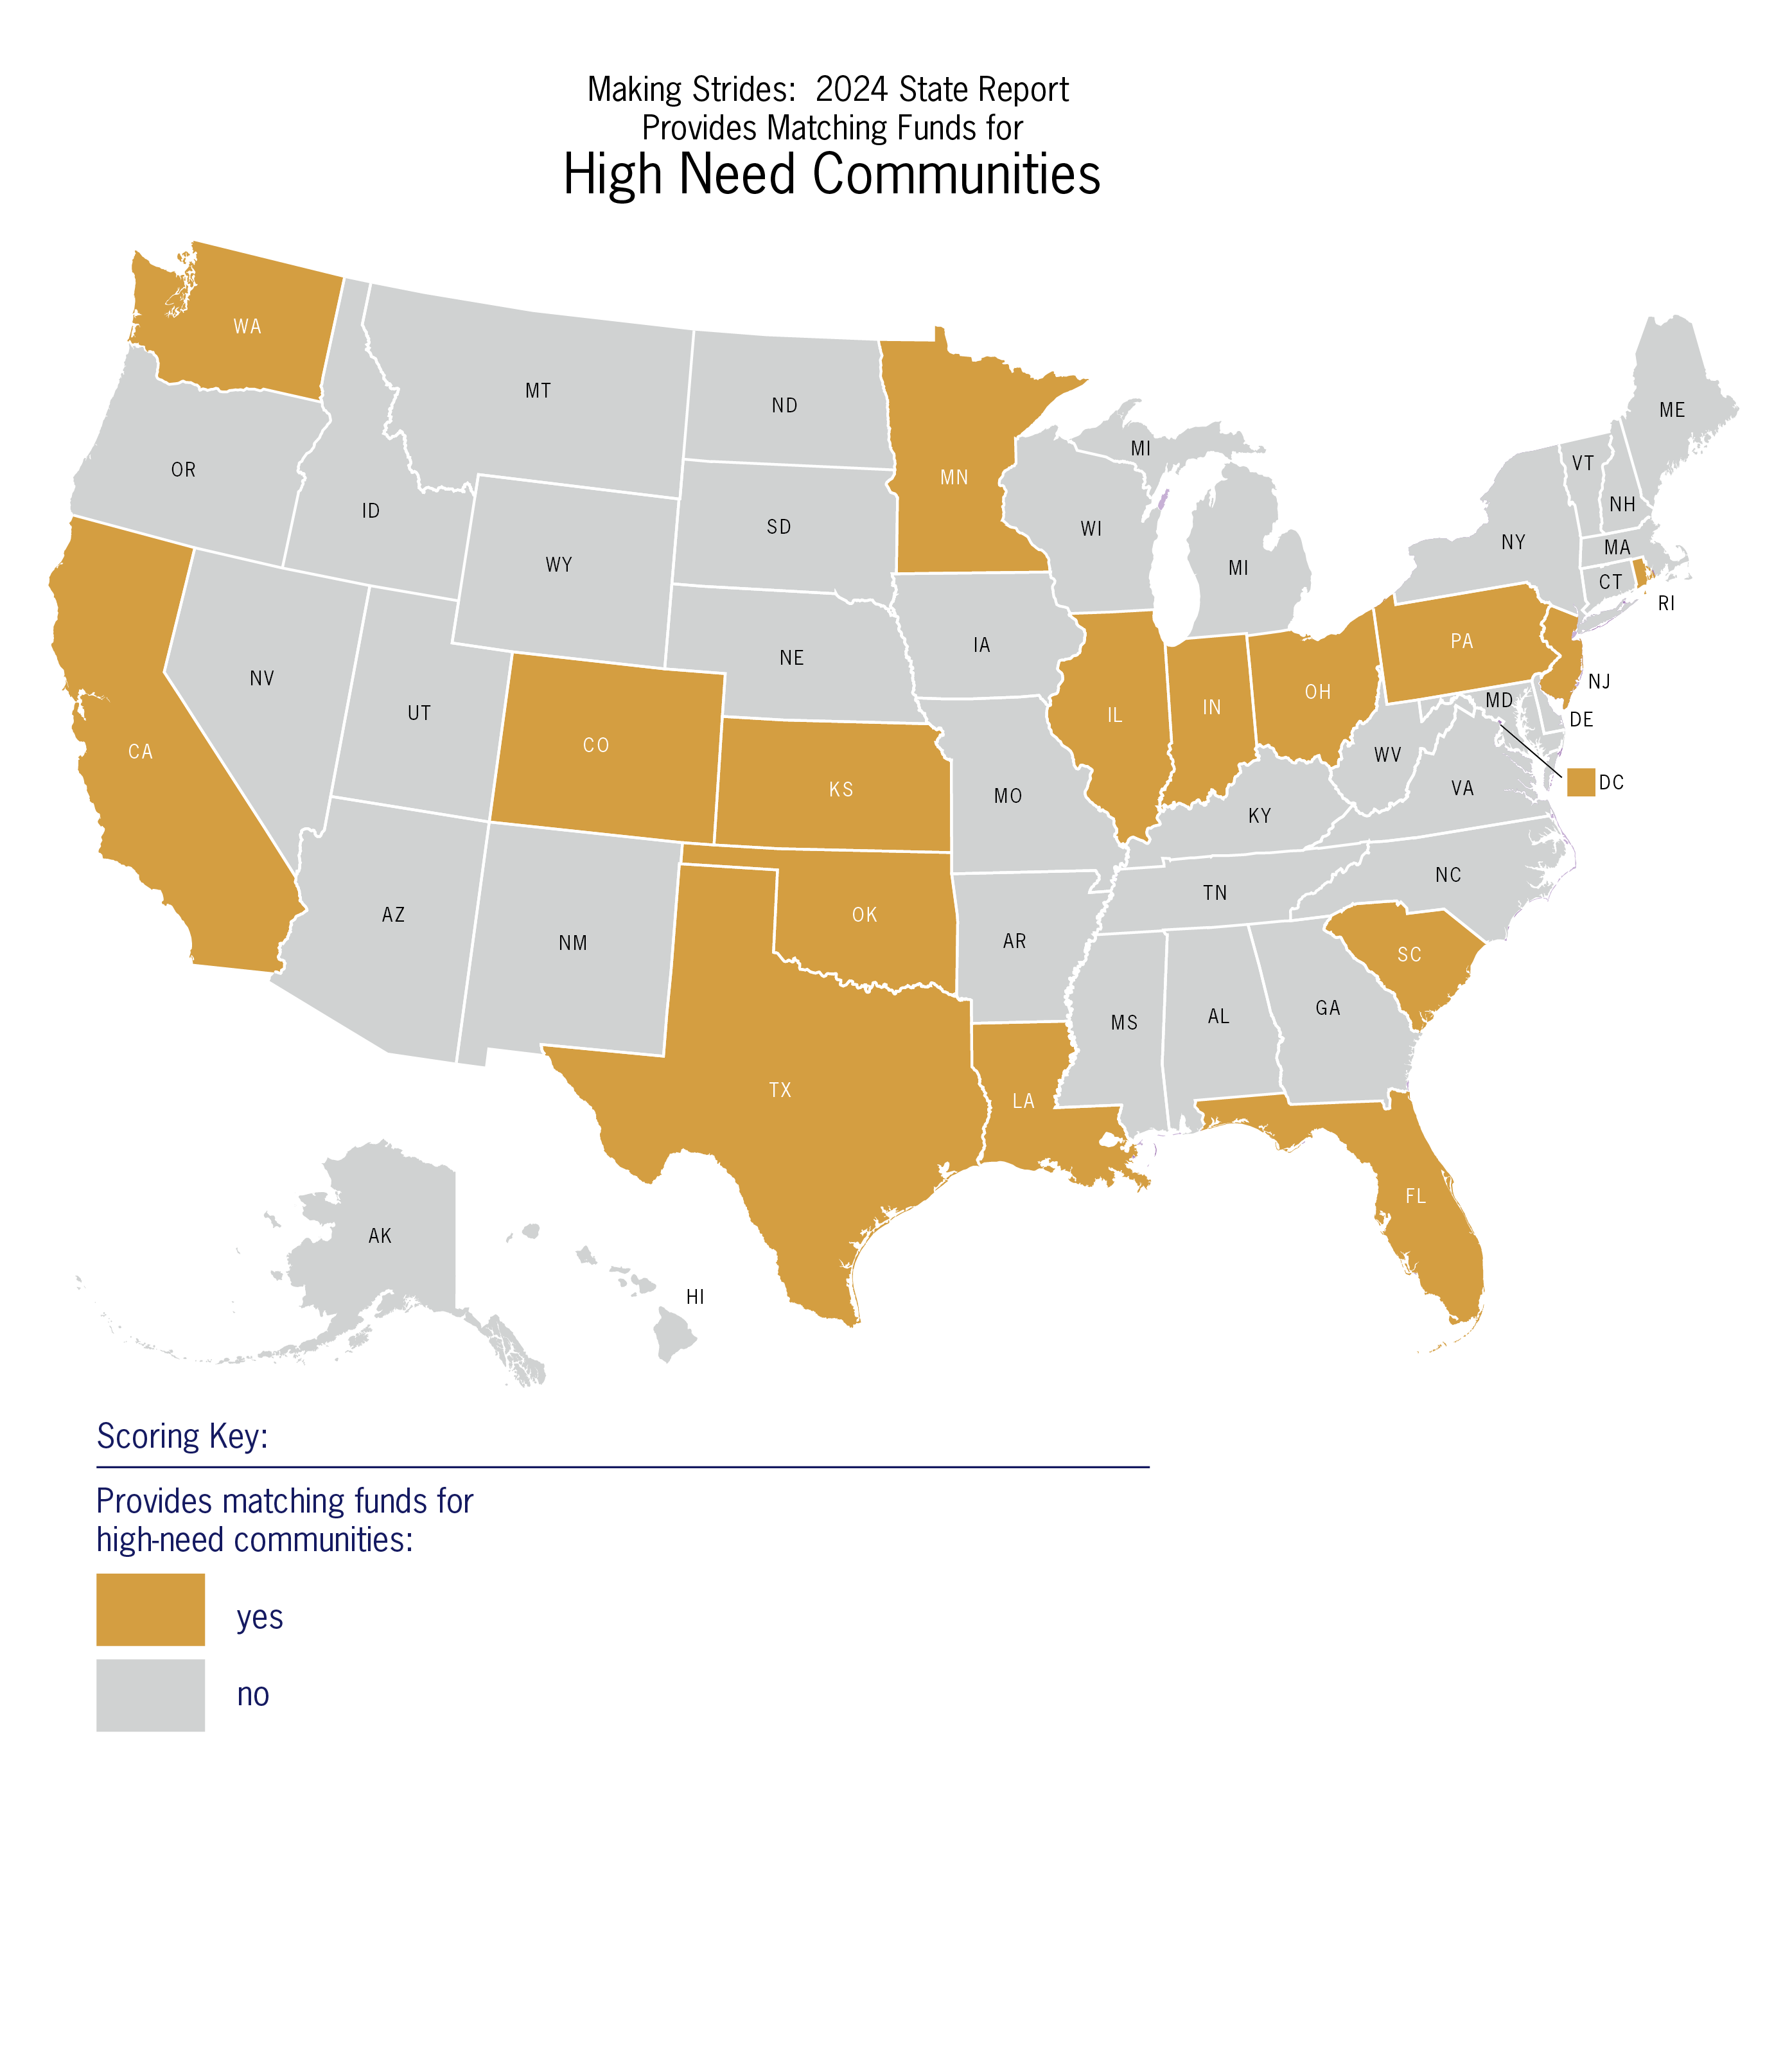
This map (Figure 3 in report) shows which states provide matching funds for high need communities within the Transportation Alternatives Program. In 2024, 17 states provide matching funds for projects that benefit high need communities.

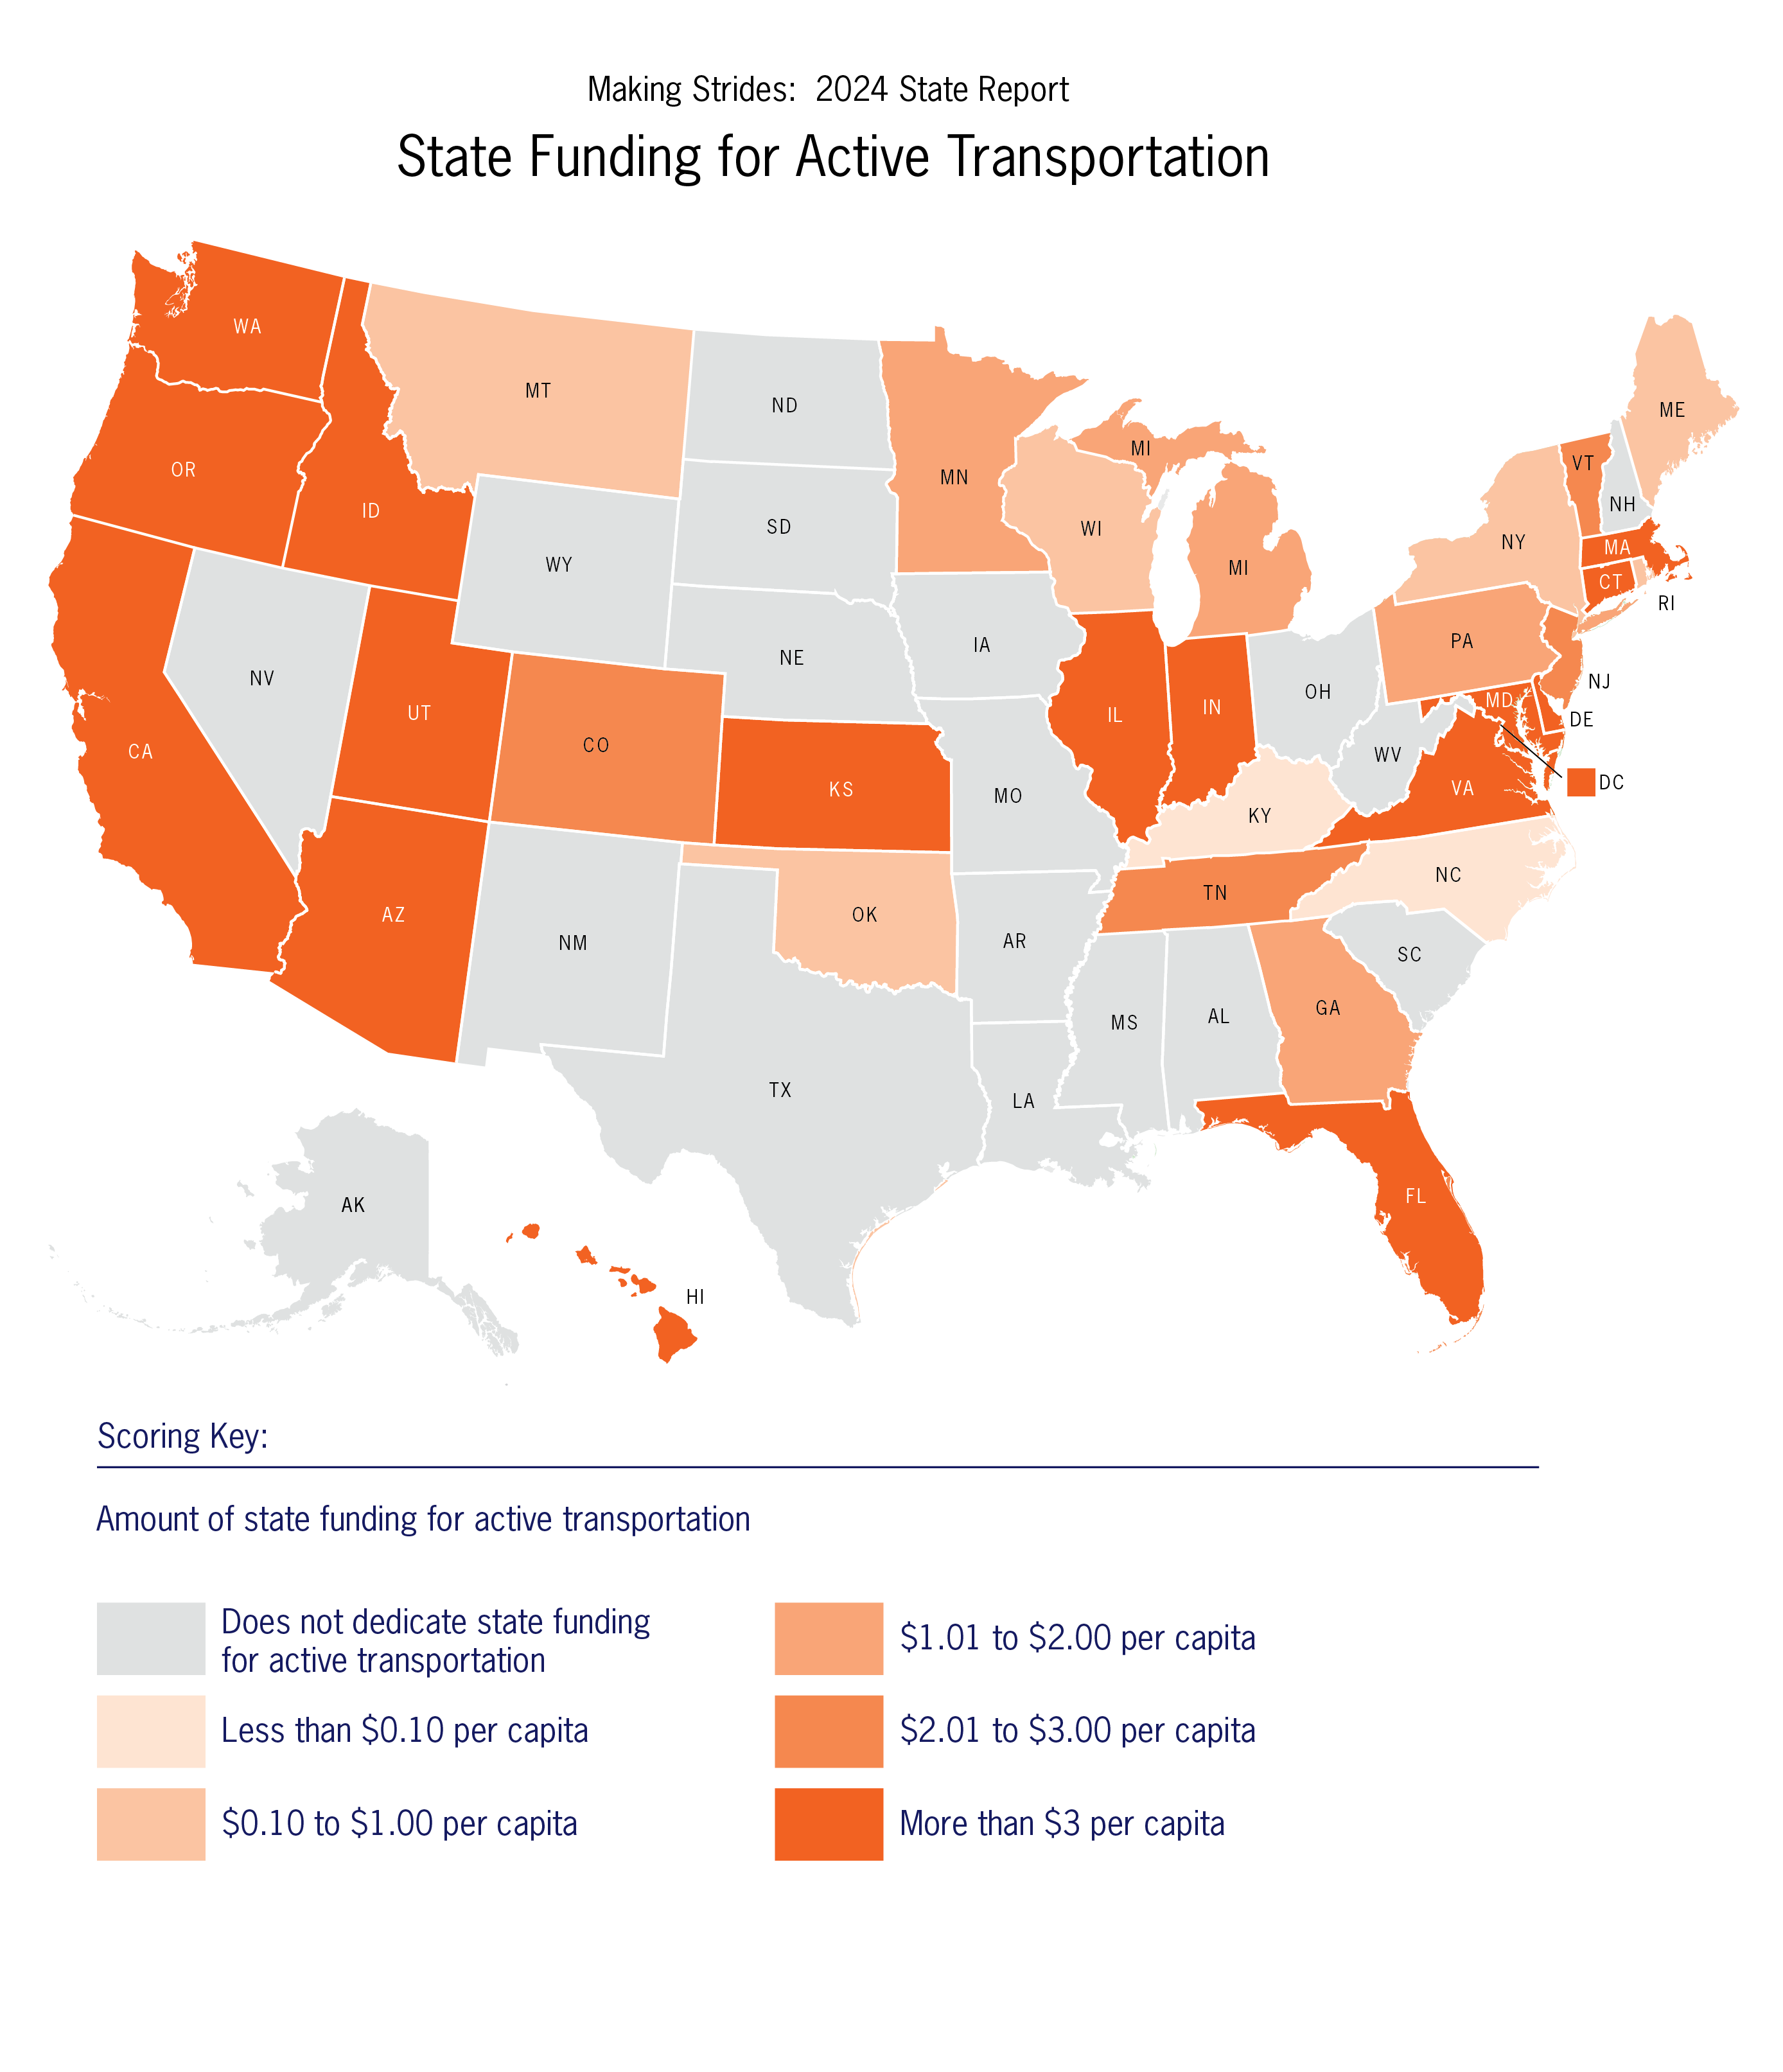
This map (Figure 4 in the report) shows the states providing state funding for active transportation with state revenue. In 2024, 33 states dedeciate their own revenue for walking, biking, and/or Safe Routes to School. The two-year average for annual state spending on active transportation reached over $1 billion in annual funding, demonstrating that states continue to invest significant state money to support and promote safe walking and bicycling. Of the 33 states dedicating funding, 23 states increased their per capita spending since 2022.

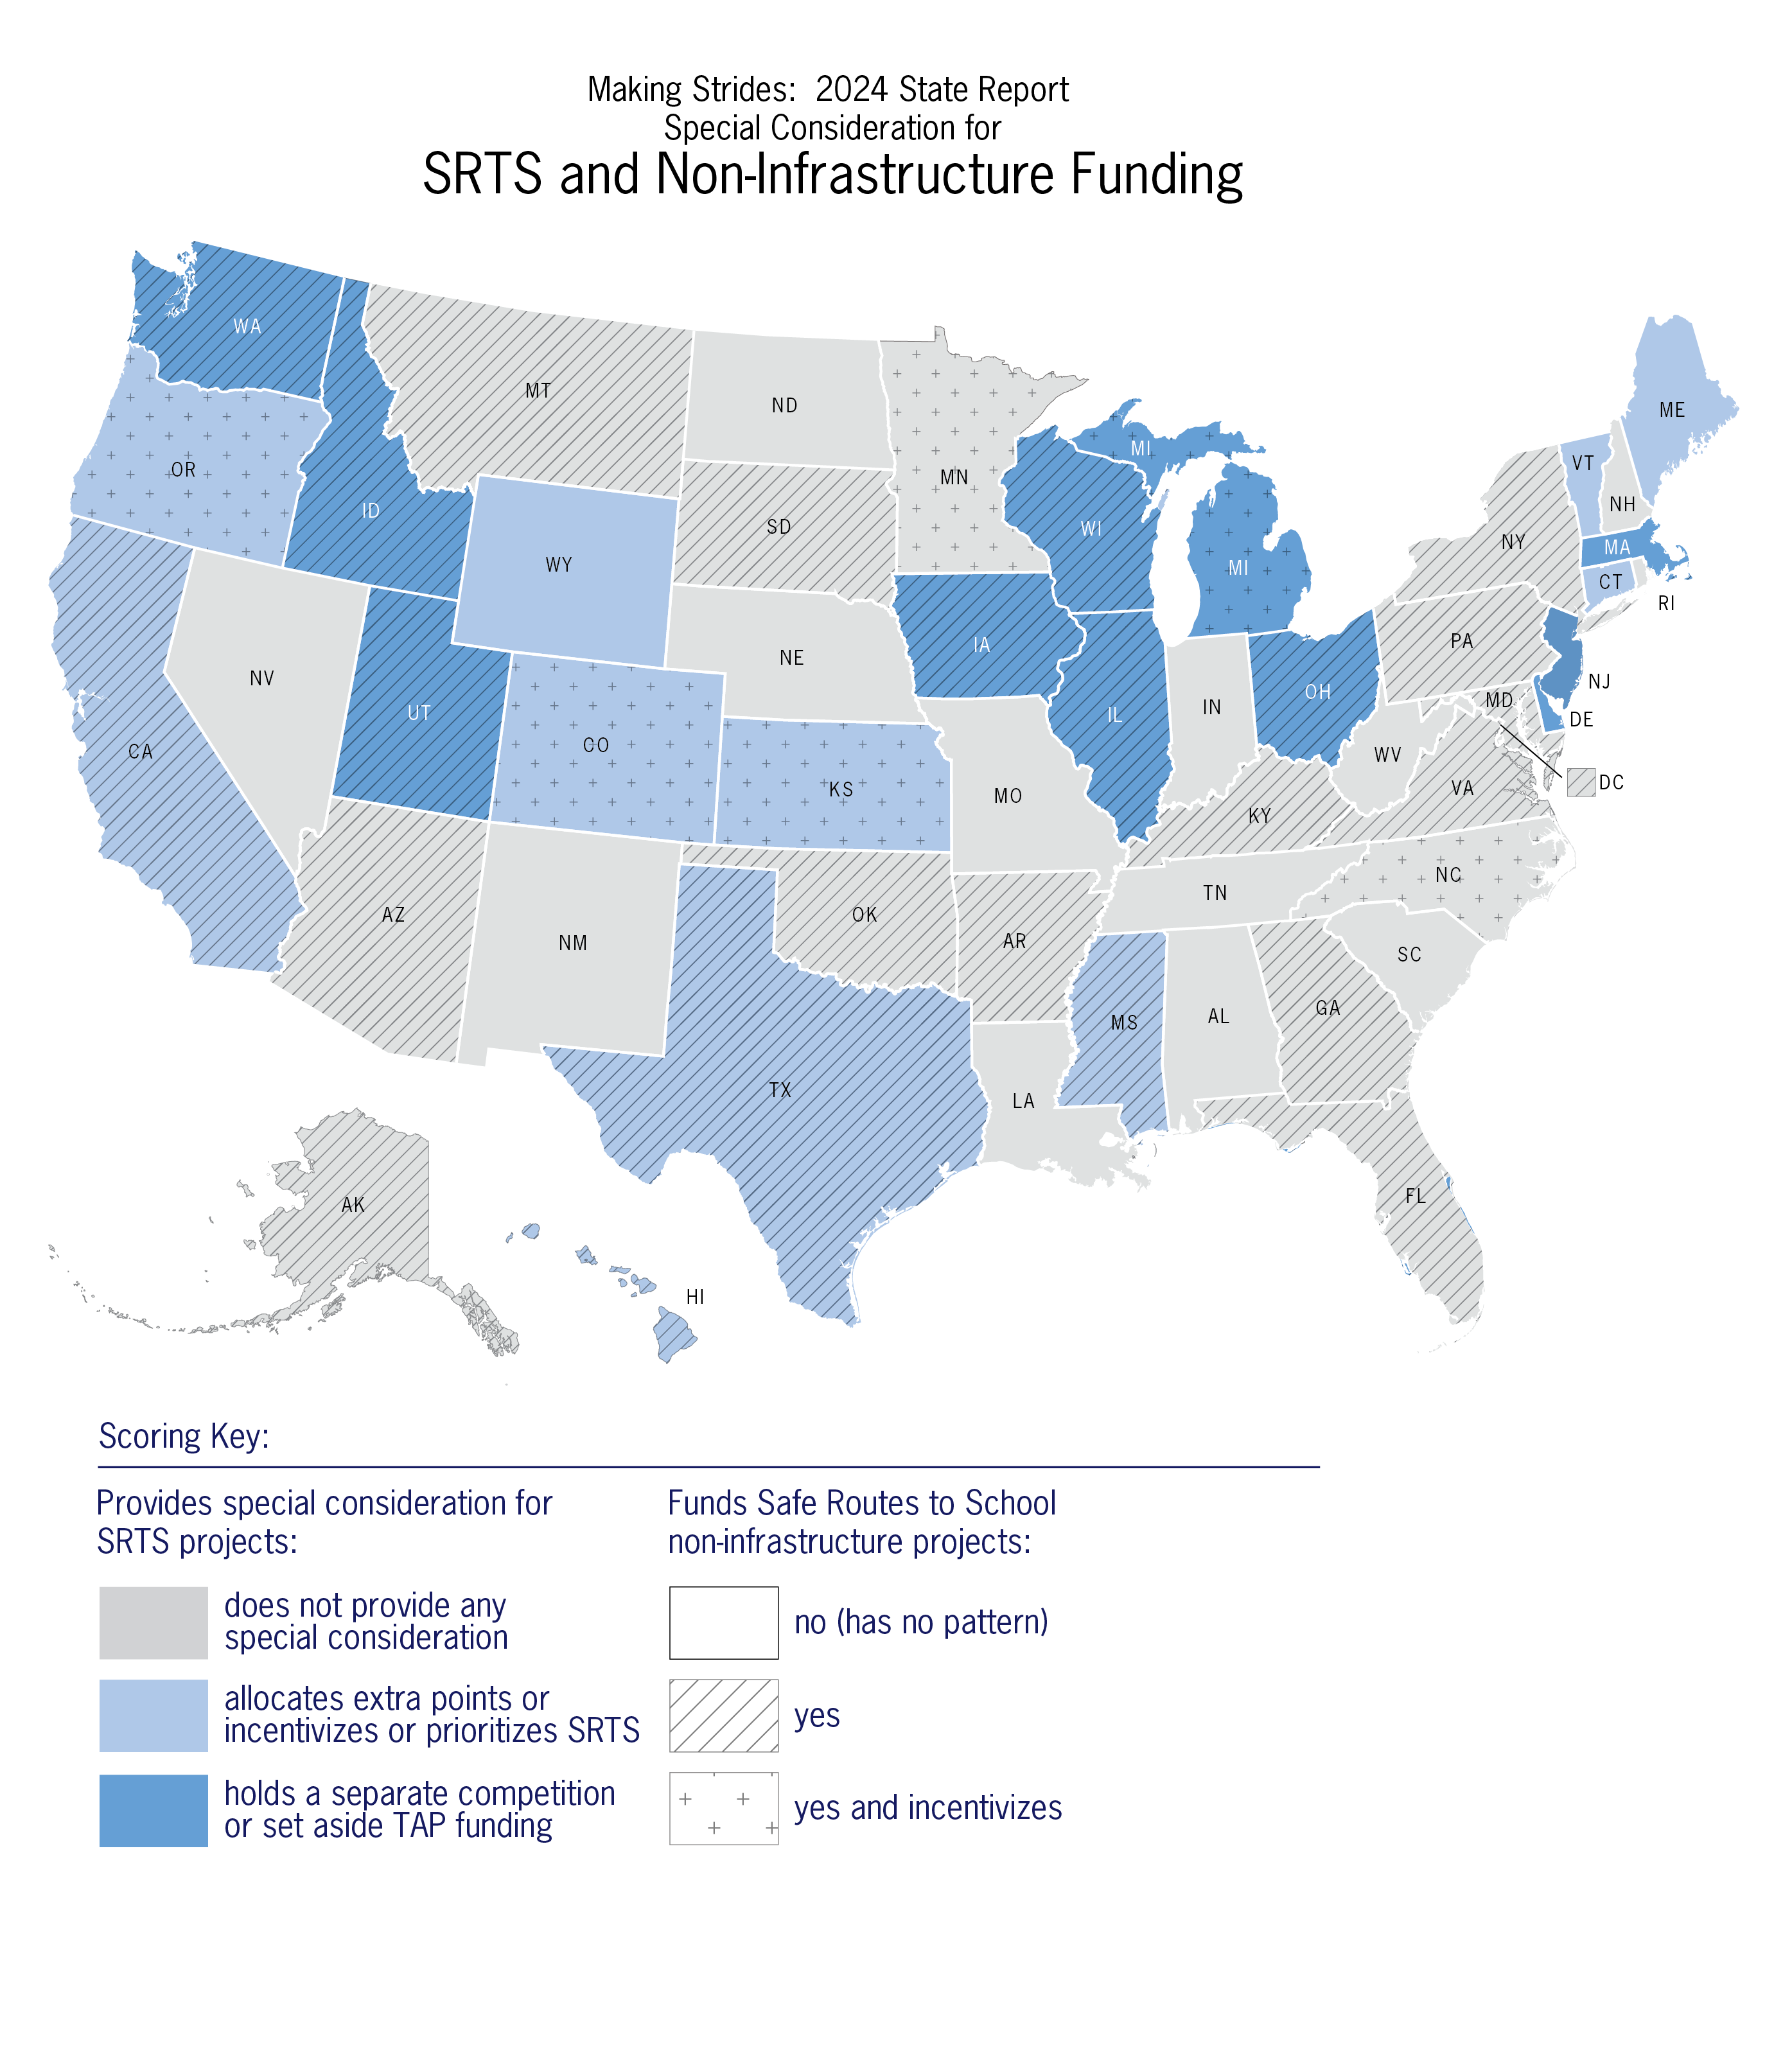
This map (Figure 5 in the report) shows the degree to which states are providing special consideration for Safe Routes to School projects and/or funding non-infrastructure projects within the Transportation Alternatives Program. 21 states either provide a scoring preference or set aside TAP funding specifically for Safe Routes to School. As of 2024, 32 states allow funding Safe Routes to School programming with Transportation Alternatives Program funding, which means 19 states are choosing not to make it eligible to their communities, as it is eligible under federal law.

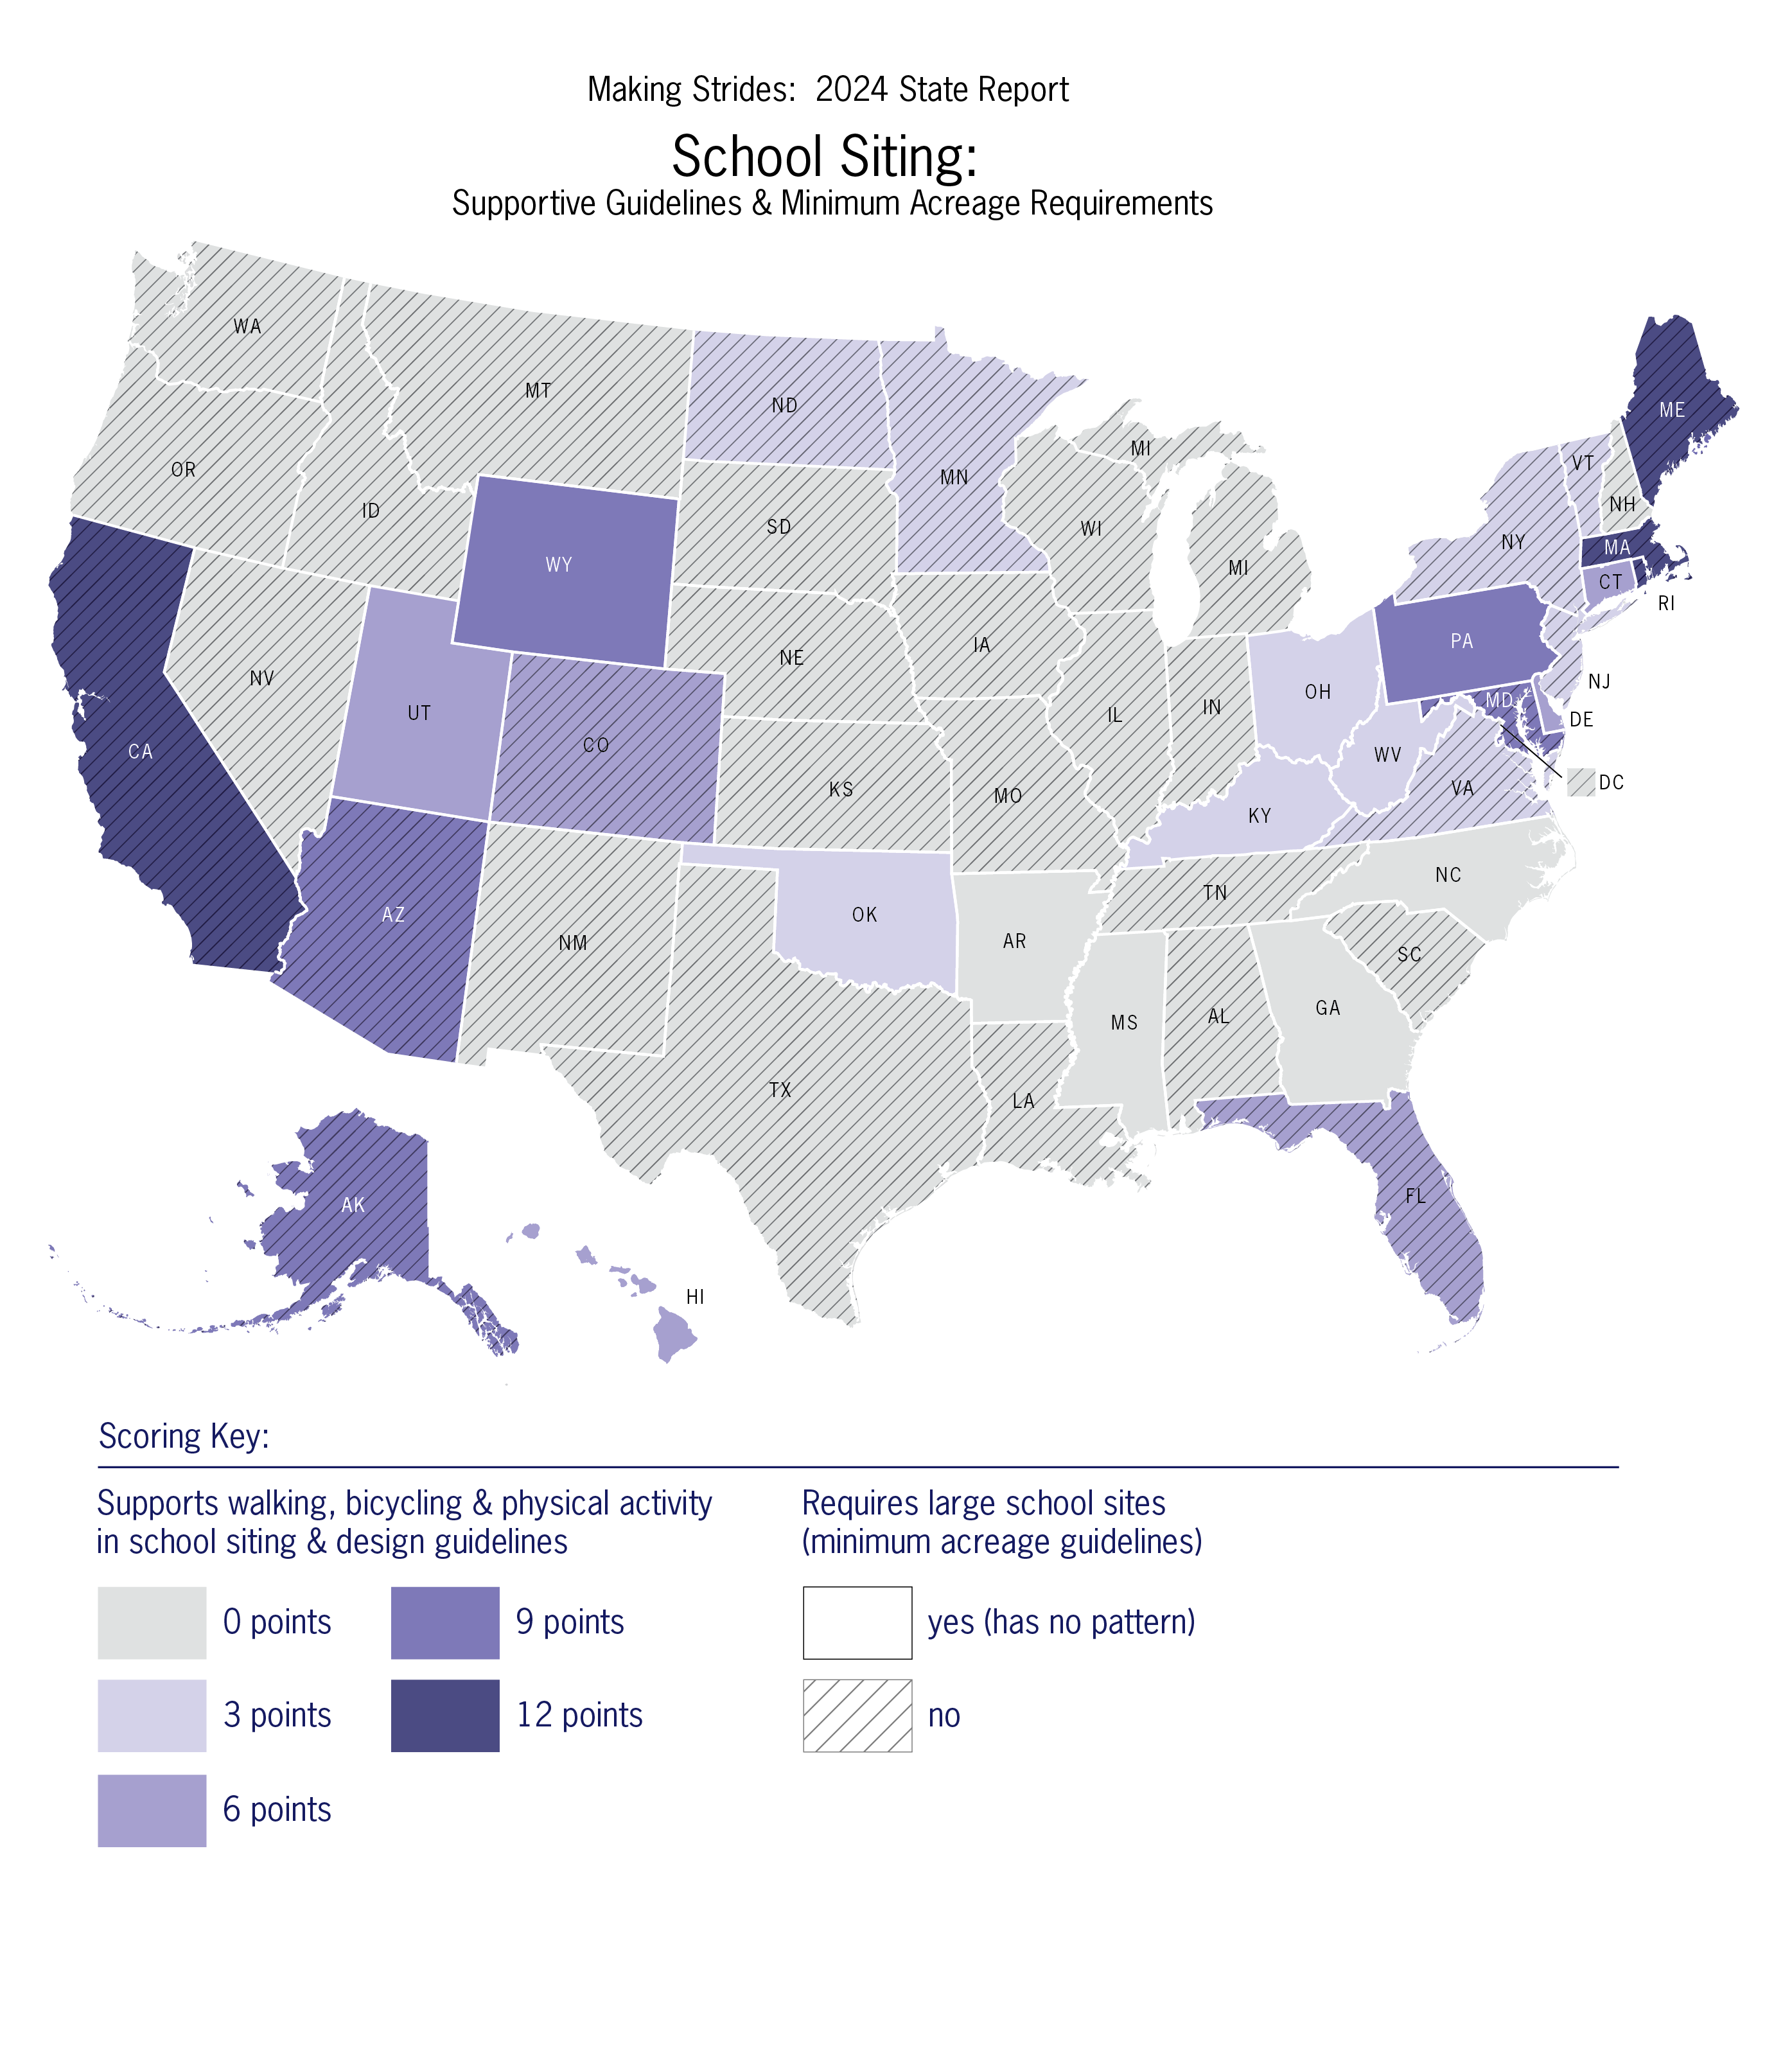
This map (Figure 6 in the report) indicates whether a state’s school siting guidelines are supportive of walking and bicycling to school. This as a policy area where there is significant potential for additional state action. Support for walking, bicycling, and physical activity within states’ school design guidelines remained steady at 11 states from 2022.

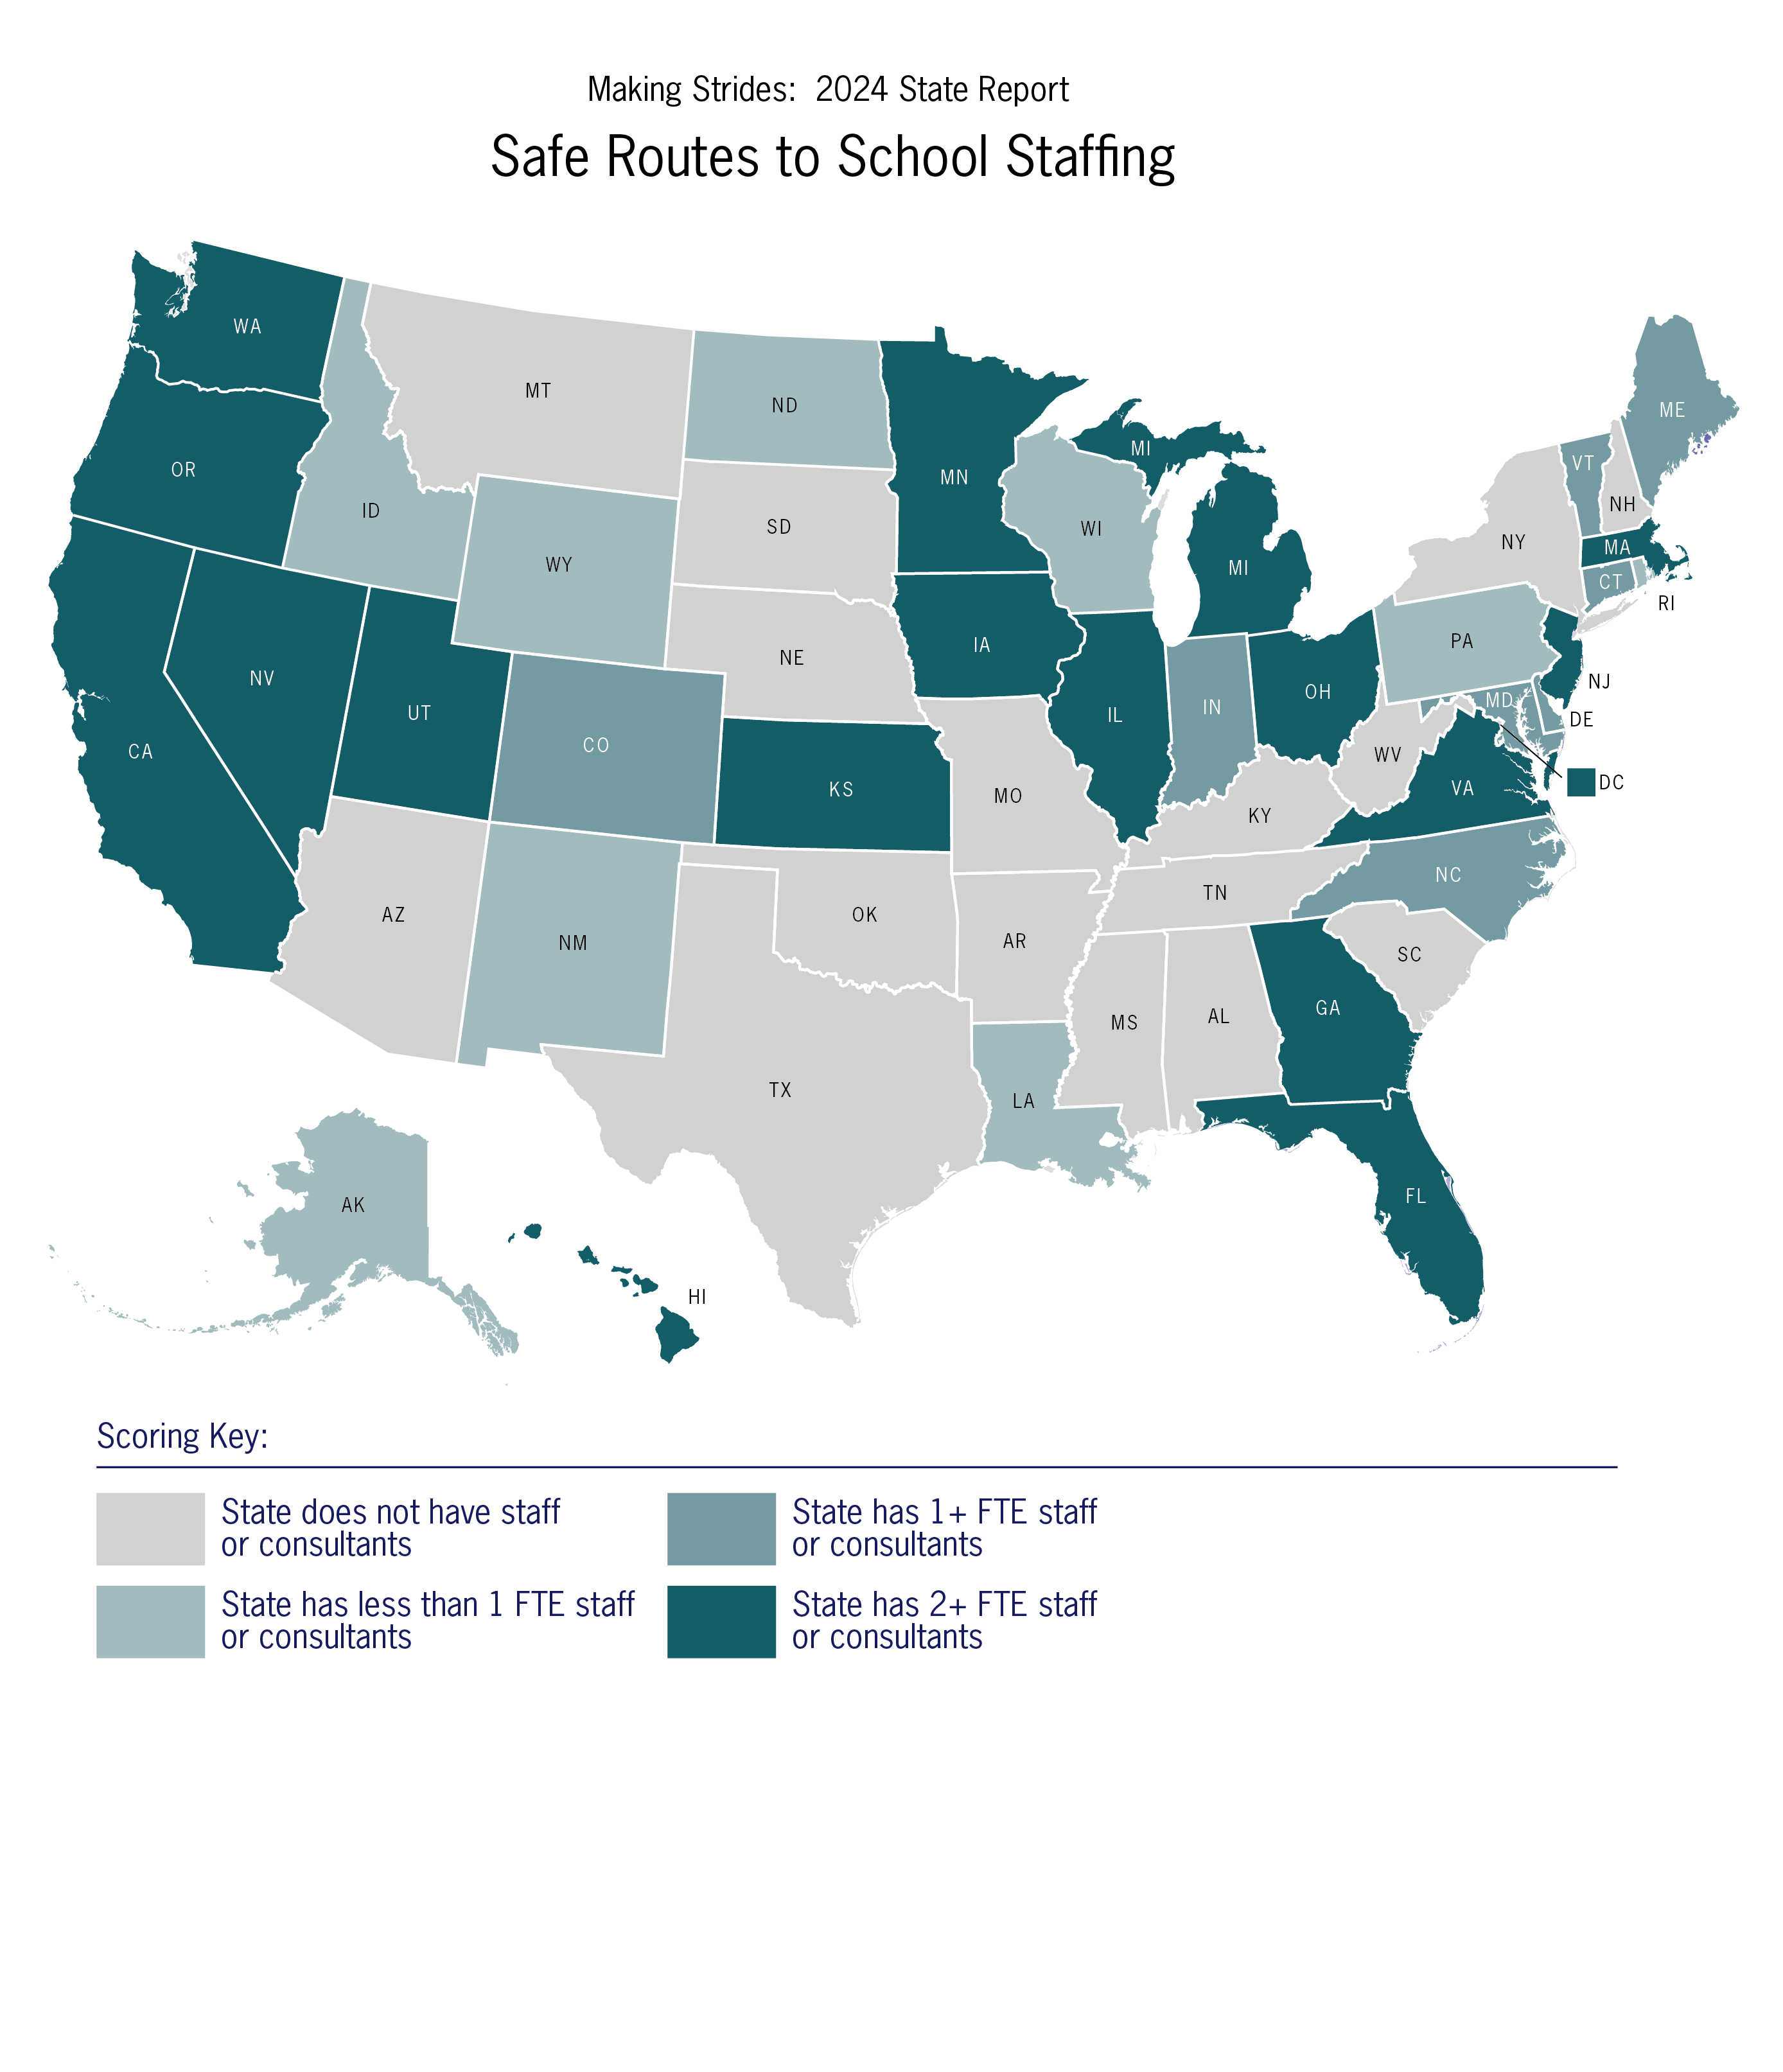
This map (Figure 7 in the report) shows the level of staffing each state has for Safe Routes to School. As of 2024, 18 states have at least two full-time equivalent staff (FTE) that focus on Safe Routes to School, and in addition to those 18, another 8 states have at least one FTE focused on Safe Routes to School. Recent research shows a correlation between the presence of a statewide Safe Routes to School coordinator and other best and emerging practices.


Tables in appendices of the report summarize scoring for each indicator in each of the core topic areas
by state.
- Appendix A summarizes scoring by state for the indicators in the Complete Streets and Active Transportation core topic area.
- Appendix B summarizes scoring by state for the indicators in the Federal and State Active Transportation Funding core topic area.
- Appendix C summarizes scoring by state for the indicators in the Safe Routes to School Funding and Supportive Practices core topic area.
- Appendix D summarizes scoring by state for the indicators in the Active Neighborhood and Schools core topic area.
- Appendix E summarizes the overall scores and grades by state in 2024.
- Appendix F summarizes minimum acreage requirements for schools at each grade level and each state’s correlating score.
- Appendix G summarizes state support for walking, biking, and physical activity in four key areas within school siting and design guidelines and each state’s correlating score.

The 2024 SRP Report Card was made possible by cooperative agreement OT18-1802 from the Centers for Disease Control and Prevention’s Division of Nutrition, Physical Activity, and Obesity. The report is solely the responsibility of SRP and does not necessarily represent the official views of the CDC.
